Washington State · A white paper from the Eviction Research Network
Rents have outrun incomes, and the guardrails that held filings down have lapsed. Filings are not receding; they have locked in about 44% above pre-pandemic levels and stayed there. Now the federal supports that kept things from getting worse are being withdrawn, just as Washington's own data show what withdrawal does. An eviction filing is the leading edge of displacement, the signal that comes before a wave of homelessness. We know how to answer it, if the state acts in time.
An exploratory analysis of county-level patterns and a review of the eviction-prevention literature. It describes correlations and policy context, not proven causes.
In brief · for Washington's lawmakers
Eviction filings are the first number to move in a displacement crisis; they rise before the shelter lists, before the street count. Washington's has just hit a record, while the supports that keep that number from becoming a homelessness wave are being cut. The warning is not coming. It is already here, in the data.Built from court records and peer-reviewed evidence rather than from alarm, which is exactly why it should be read closely.
Five things every Washington lawmaker should know:
This is a new normal, and a new normal is more dangerous than a spike.
March 2026's 2,406 filings beat the prior record by 3.5%. Strip out seasonal swings and it ranks only 11th among the series' biggest surprises. That is not because the danger is small. It is because the real surges already happened in fall 2023, and filings never came back down: they settled about 44% above pre-pandemic and held there. A spike recedes on its own; a new floor does not. Washington's floor is now a record-high one, and nothing in the data points back toward the old one.
Rent outran incomes.
Metro Seattle asking rents are up roughly 43% since 2017, about double the rise in metro Minneapolis. Across US counties, the share of renters paying 50%+ of income on rent is one of the two most reliable markers of where filing rates are high.
The guardrails came down, and the timing is not a coincidence.
Federal rental aid and Washington's mandatory pre-filing mediation (the Eviction Resolution Pilot Program) held recorded filings low through mid-2023. When the pilot sunset on July 1, 2023 and aid ran out, filings surged that fall, producing the four biggest surprises in the whole series. Much of the "increase" since is the return of cases the guardrails had been holding back.
Washington already has the highest-evidence tools; it just isn't using all of them fully.
The prevention measures with the largest documented effects, in order, are direct rental assistance, right to counsel, and pre-filing mediation. Washington has begun all three: it was the first state to guarantee tenants a lawyer (2021) and capped rents statewide in 2025. But its right-to-counsel program reaches fewer than half of tenants, and it let its mediation pilot expire.
The biggest unknown is local effect size.
Most published numbers for these levers come from other cities. The single highest-value next study is a Washington-specific measurement of how much rental assistance reduces filings here. The data exist; the estimate does not.
The bottom line: this is severe, and it is solvable. The evidence on what works is unusually strong, and Washington already holds most of the levers. What is missing is the decision to use them before the federal supports fall away. That is what makes the situation both alarming and hopeful: the state is not waiting on a discovery, only on a choice.
1 · The trend
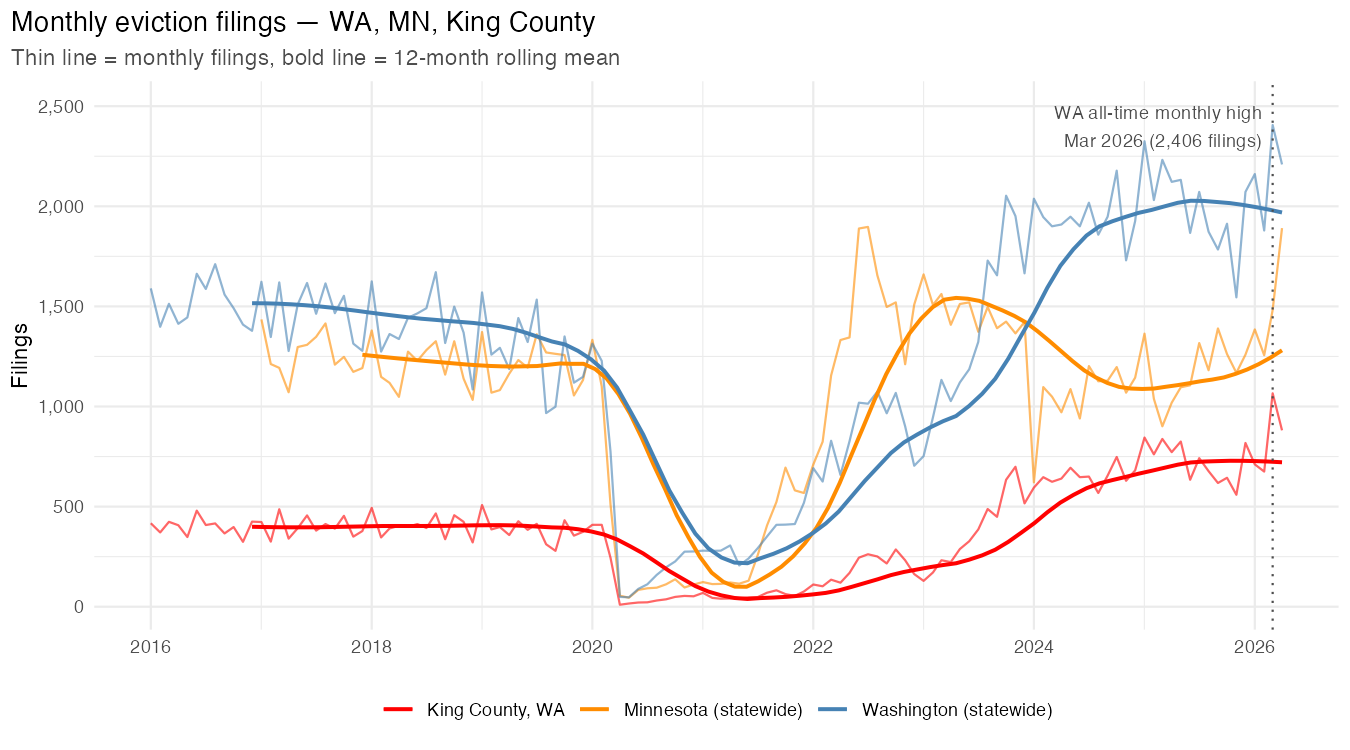
In March 2026, Washington's superior courts recorded 2,406 eviction filings, the highest single month in the recorded series, including 1,066 in King County, also a record. More records will follow, and that is the warning, not because any single month is a freak event, but because the trend has climbed for three years and settled at a new, far higher altitude. Filings over the year ending April 2026 totaled about 23,913, roughly 44% above pre-pandemic, and they have stayed there. A spike recedes; this has not.
It would be easy to file a record month under "statistical blip." That reading is wrong, and it is the costly mistake to make. Strip out the normal seasonal rhythm and March 2026 ranks only 11th among the series' biggest surprises, because the genuine surges already happened, in fall 2023, when filings stepped up to a new level all at once and never receded. The record isn't the shock; it is the proof that the shock became permanent.
Under the hood: how we separate "level" from "shock"
For each month we compute an expected count from the recent trend and the pre-pandemic seasonal pattern, then measure the gap:
The seasonal index comes from 2017–2019 monthly means. March 2026's residual is +361 filings: real, but ranked 11th. The four largest residuals are all fall 2023: October +769, November +762, August +631, September +627. The 12-month total is 23,913 (ending April 2026) vs. 16,649 a year before the pandemic, a rise of +43.6%. (Against calendar 2019 the rise is +57%; we lead with the more conservative 12-month basis.)
Moratoria cut filings to a tenth of normal; by mid-2023 they had climbed back through the baseline and stayed there.
Monthly filings for Washington, Minnesota, and King County, with 12-month rolling totals. Washington's record months are the top of a multi-year climb, not isolated peaks.
2 · The fall-2023 step-up
Washington's filings did not climb smoothly; they stepped up sharply in fall 2023. Through mid-2023, two things held recorded filings down. The first was federal emergency rental assistance, which paid tenants' back rent. The second was Washington's Eviction Resolution Pilot Program (ERPP), a statewide requirement, from November 2021, that a landlord obtain a Dispute Resolution Center certification before a nonpayment case could be heard. Court data show the program routed a measurable share of cases out of the filing count entirely.
The pilot sunset on July 1, 2023, just as rental aid ran out. Over the next six months recorded filings more than doubled, topping 2,000 a month by October. So part of the 2023→2024 step-up is not a fresh surge in distress; it is the removal of a diversion valve, with filings rising back toward the level that had been occurring all along. This is the single most important annotation on the Washington time series, and it is also a rehearsal: Washington has already shown, in its own data, what happens when guardrails are removed. The federal government is now preparing to remove far larger ones, the subject of this paper's closing section.
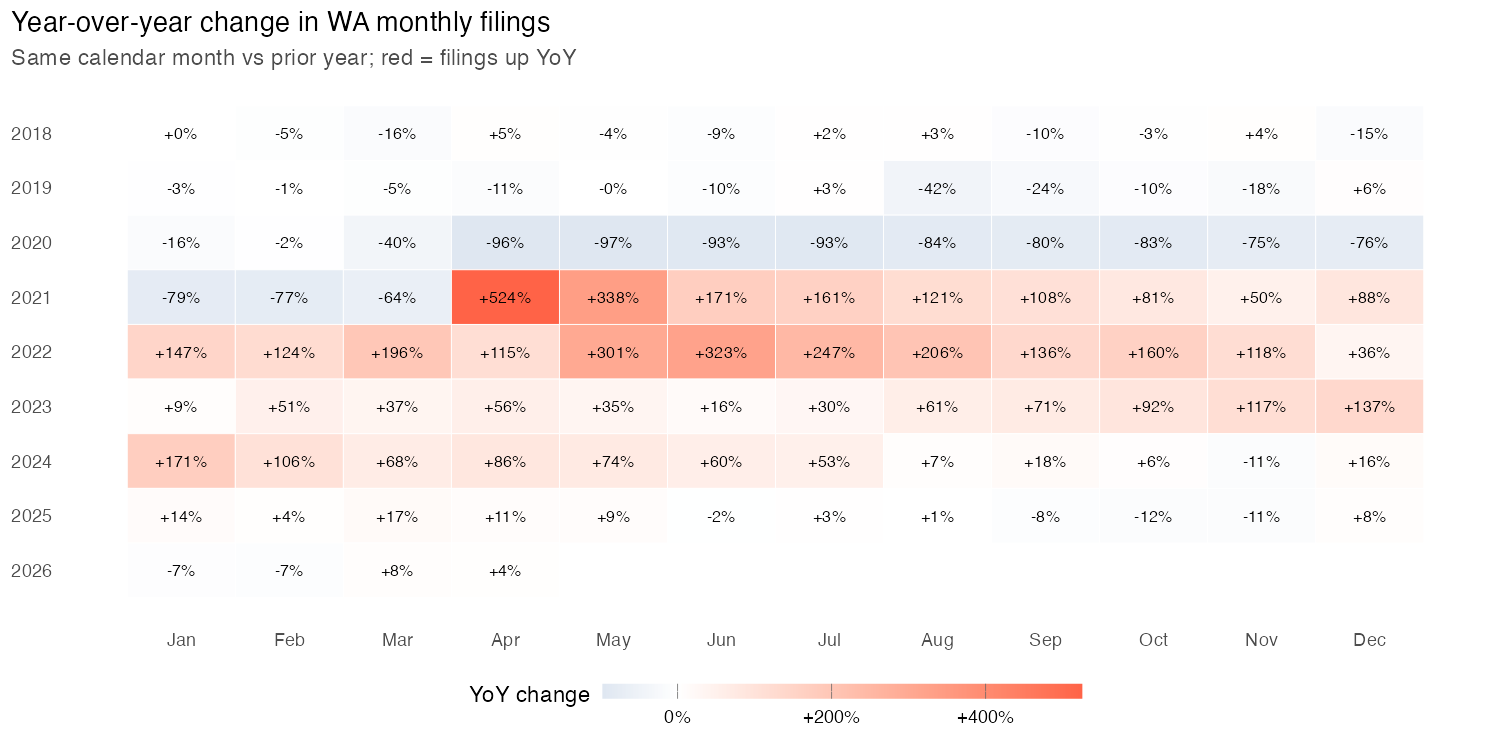
Growth cooled to near zero, because filings had already locked in at a record-high level.
Year-over-year percent change, each year by calendar month. The deep-red 2022 row is the post-moratorium backlog; by 2025 the grid cools to near zero. That is not relief but a high plateau holding firm.
How to read this heatmap
Each square is one month compared with the same month a year earlier: a growth rate, not a count. Rows are years (2018 at the top, 2026 at the bottom); columns are calendar months, January through December.
Color: red means filings rose versus a year before, blue means they fell, and near-white means roughly flat; the deeper the red, the larger the year-over-year jump. The blue band across 2020 is the moratorium collapse, with filings down as much as 97% from the year before.
Mind the base effect. The huge reds of 2021–2022 (for example, +524% in April 2021) are mostly arithmetic: they are measured against the near-zero moratorium months of 2020, so even a modest rise in actual filings reads as an enormous percentage. Treat them as "rebounding off a floor," not "five times worse."
The point of the plate. By 2025 the grid fades to near-white, and that is not the crisis easing. A year-over-year change near zero on top of a record-high level means filings are holding at that high level, not returning toward normal. Here, pale means stuck at the top, not "back to baseline."
3 · The pressure underneath
Behind the policy timing is a slower, structural pressure. Metro Seattle asking rents rose from about $1,464 to $2,091 between 2017 and mid-2025, a 43% nominal increase, roughly twice metro Minneapolis's 21%. That is the rent shock the rest of this analysis keeps returning to.
When the federal evaluation of pandemic rental assistance summarized the post-2022 world, it put the point plainly: emergency aid "was neither intended nor equipped to address the nation's pre-existing and continuing housing challenges. As of 2023, a quarter of US renter households were severely rent-burdened, spending half or more of their income on rent." Aid was the dam; unaffordability is the river.
4 · What predicts where filings are high
To ask which county conditions travel with high filing rates, we assembled a panel of 8,802 county-years across 1,369 counties (Washington and Minnesota court records plus a 29-state national extract, joined to Census demographics and rent), and fit three models that learn in very different ways: a Bayesian machine-learning model (BART), a random forest, and a plain regression (OLS). The point of using three is that anything real should show up in all of them.
Two features survive that test:
Almost everything else is fragile: the models disagree about it, and a fourth check (bootstrapping the importance scores) shows the rankings are within noise. Unemployment, for instance, tops one model's importance list but is statistically insignificant in the regression and ranks 8th in another, a clean example of why a single model's "top predictor" can mislead.
Under the hood: the actual coefficients and fit
Model fit (moderate, by design). Cross-section BART: in-sample R²(log) = 0.55; 10-fold cross-validated R²(log) = 0.38; OLS R² = 0.30; random-forest out-of-bag R² = 0.51. About 60% of county variation in (log) filing rate is unexplained, hence "screening tool, not effect sizes."
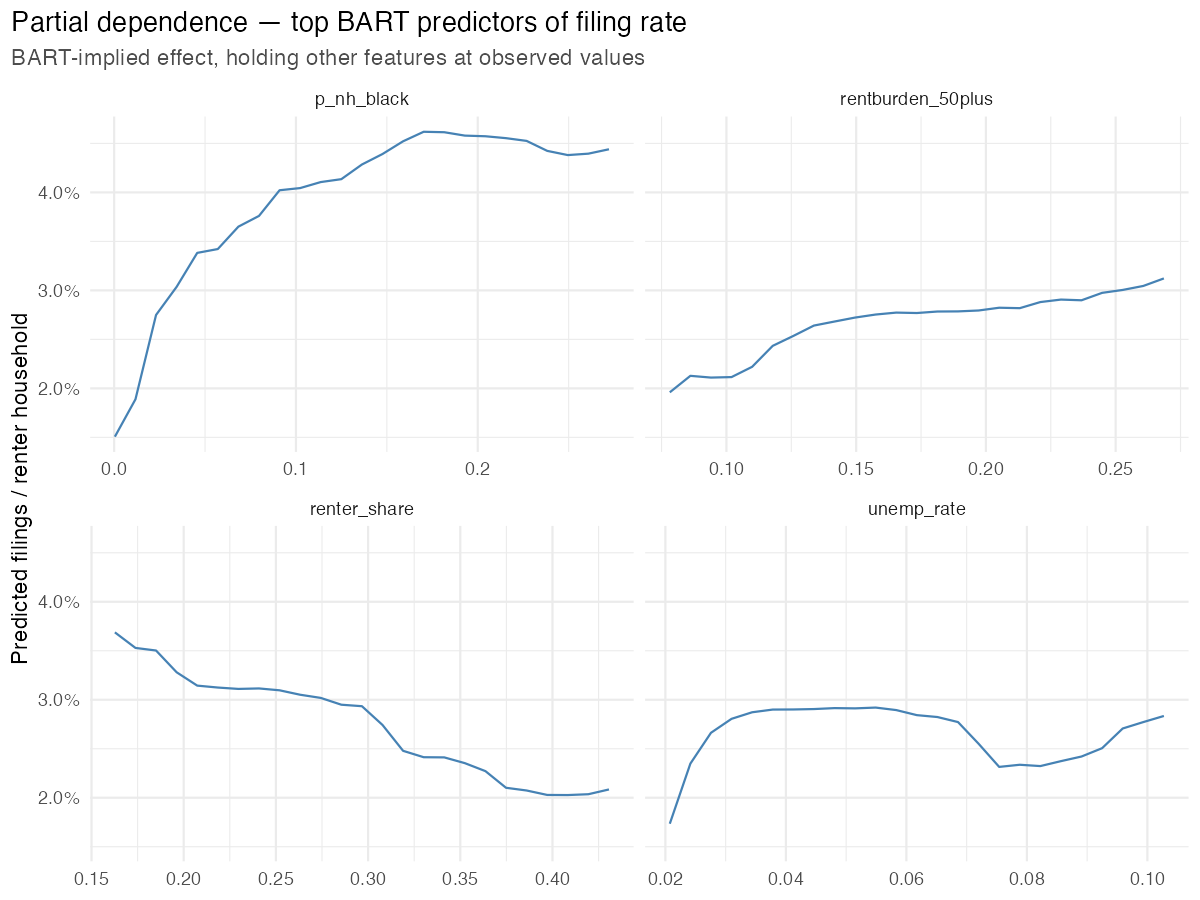
Standardized OLS coefficients (per 1 SD; |t| shown). Non-Hispanic Black share β=+0.44, t=9.8; severe rent burden β=+0.24, t=6.7; median rent +0.22, t=3.0; single-family-rental share −0.22, t=−5.3; renter share −0.16, t=−3.5 (collinear with rent burden). The partial-dependence slope for Black share rises from a predicted ~1.5% to ~4.6% filing rate across its range.
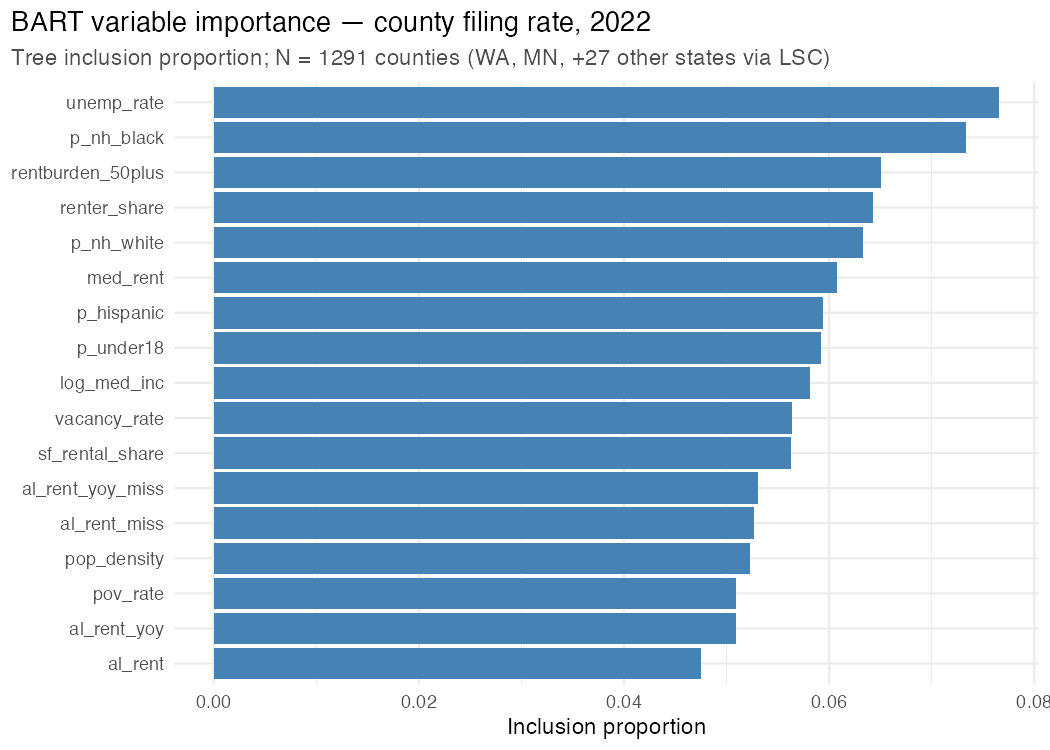
Why the rankings are "noise." BART tree-inclusion is normalized so a meaningless predictor scores 1/17 = 0.059. Across 30 bootstraps, the scores run 0.042–0.076 and no predictor clears two standard deviations above that uniform baseline, so the fine rank order should not be over-read. The robust evidence for the two signals comes from the OLS coefficients and partial-dependence curves, not from the importance ranking. Adding 2020 Democratic vote share gives a real but modest β=−0.13 (t=−2.33), most plausibly a proxy for state/local tenant-protection regimes.
As severe rent burden and Black population share rise, predicted filing rates climb steeply; the other features are flat or wobbly.
Partial-dependence curves for the top features: how the predicted filing rate moves as each feature sweeps across its range, holding the others fixed.
The importance scores are nearly flat, which is why we lead with two signals, not a ranking.
BART variable-importance (tree-inclusion) for the cross-section. The bars cluster near the "meaningless" baseline; the lesson is humility about the rank order.
5 · The King County question
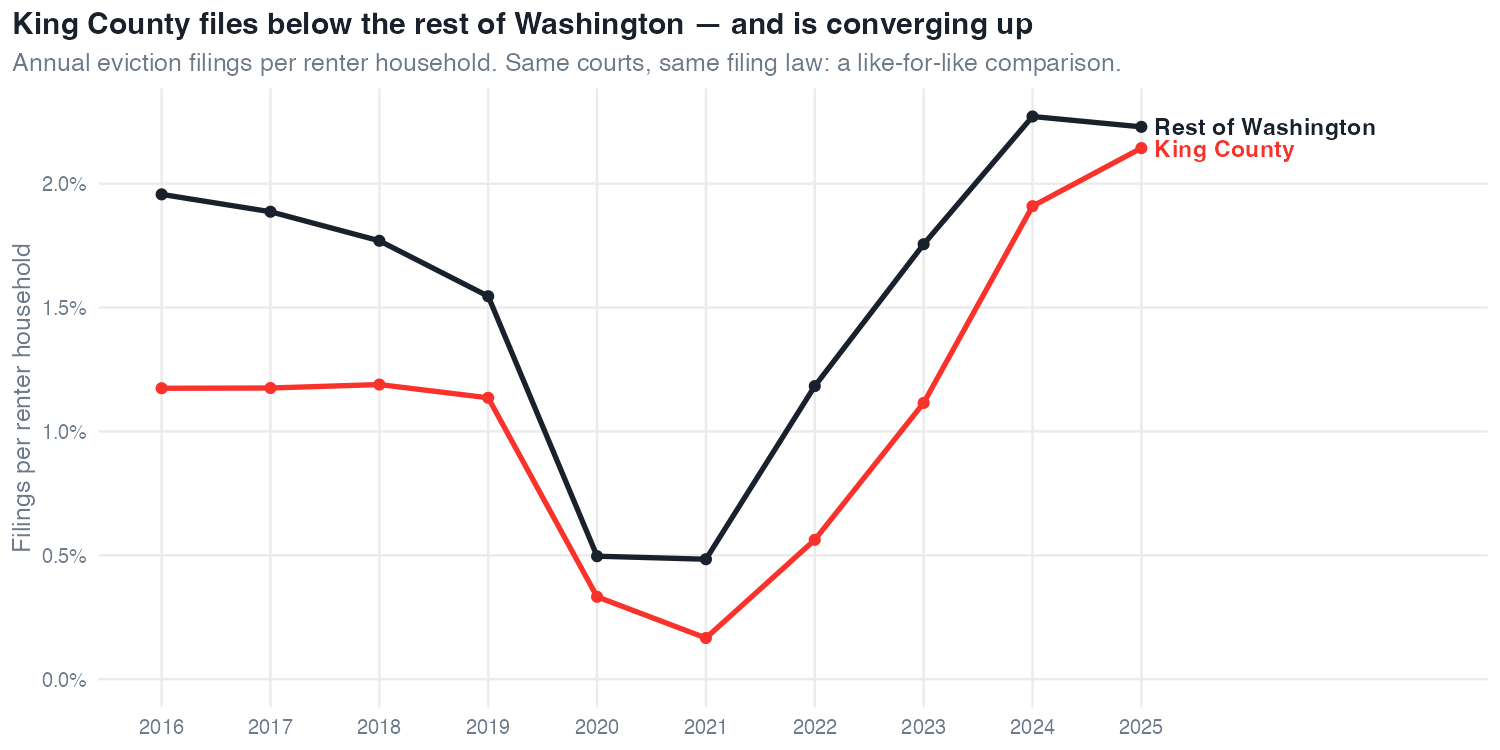
King is the county everyone asks about. The honest way to place it in context is to compare it with the rest of Washington, using the same courts, same filing law, and same data source, and to watch it over time. We deliberately do not benchmark King against other states or a national model: what counts as a "filing," and when it reaches the docket, differs so much between states' legal processes that cross-state filing levels simply are not comparable. Within Washington, the comparison is like-for-like.
Read that way, King is no anomaly. It has long filed at a lower rate per renter than the rest of the state, about 0.73× the rest-of-Washington rate in 2019, before any of the 2020–21 policies. It bottomed in the 2022 post-moratorium trough (0.48×), then climbed steeply as the guardrails lapsed: its annual rate went 0.56% (2022) → 1.91% (2024) → 2.14% (2025), converging to 0.96× of its peers (essentially parity) by 2025. In March 2026, King recorded 1,066 filings, its own all-time monthly high.
The takeaway is the opposite of reassuring. King is not the exception to Washington's trend; it is catching up to it, and the trend it is catching up to is the record-high plateau this paper documents.
| Year | King | Rest of WA | King ÷ rest-of-WA |
|---|---|---|---|
| 2019 | 1.14% | 1.55% | 0.73× |
| 2022 | 0.56% | 1.18% | 0.48× (trough) |
| 2024 | 1.91% | 2.27% | 0.84× |
| 2025 | 2.14% | 2.23% | 0.96× |
King has filed below the rest of Washington throughout, and is now converging up toward it.
Annual eviction filings per renter household, King County vs. the rest of Washington. Both fall under the moratoria, then climb sharply from 2022; King closes most of the gap by 2025.
6 · Is Washington different?
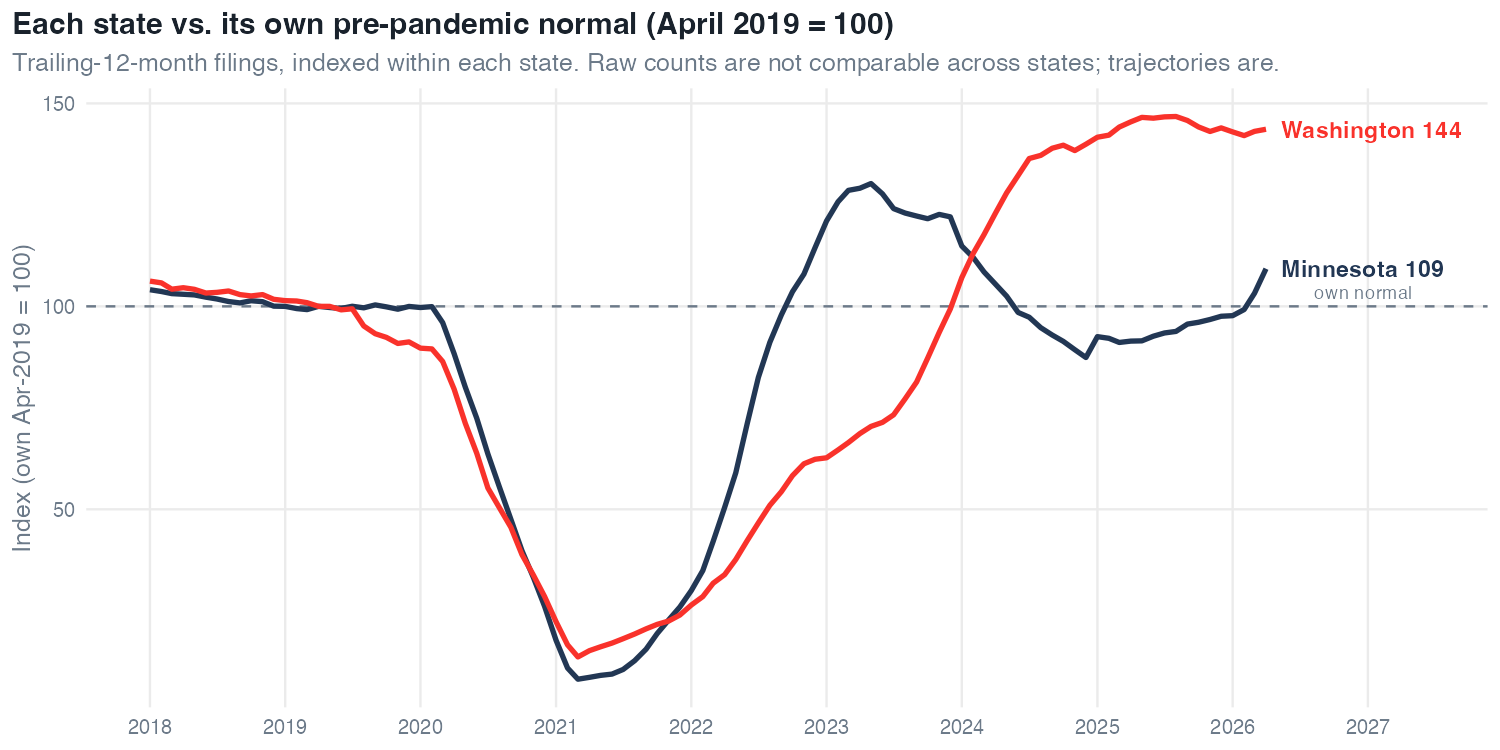
Raw filing counts are not comparable across states, so the comparison indexes each state to its own pre-pandemic normal (April 2019 = 100). On that footing the gap is clear: by April 2026 Washington sits about 44% above its own normal (index 144); Minnesota only about 9% above its own (index 109). Minnesota actually dropped below its normal in 2024 before recovering. Washington's rise is real and outsized, not an artifact of how the two states count.
It is tempting to read that divergence as a clean test of policy. It isn't: the two states differ in rent trajectories, court rules, industry mix, migration, and recent legislation. Several of those differences plausibly drive the split:
The divergence is real but multi-causal; it does not isolate a single "Washington factor."
Indexed to each state's own normal, Washington has pulled far above it; Minnesota has not.
Trailing-12-month filings, each state indexed to its own April-2019 level (= 100). Indexing removes the cross-state level problem: we compare each state with its own pre-pandemic baseline, not with the other's raw counts.
7 · What the national rental-assistance study teaches
The UC Berkeley / UPenn evaluation of federal Emergency Rental Assistance (HUD-approved, February 2026) is the closest thing to a causal anchor in this whole picture. Its findings travel directly to Washington's situation, even though Washington was not in its samples.
The catch for Washington is the evidence gap: no estimate covers Washington specifically. Closing that gap is the priority study named at the end of this paper.
Under the hood: the dose-response estimate
Tract-level, the adjusted model gives an ERA-dollar coefficient of −3.98 filings per 1,000 renters per one-unit log increase in dollars (the unadjusted estimate is −6.903). In the county model, log ERA dollars, % Black, % Asian, % unemployed, and % rent-burdened are all significant negative predictors of filings; days of moratorium carry a positive but statistically insignificant sign once dollars are controlled. Implied cost-effectiveness is roughly $7,750 per assisted household.
8 · What works
Here is the hopeful half of this report: the cure is known. An eviction filing is the leading edge of displacement, the first step on the path from a missed rent payment toward losing a home, and, for those who fall furthest, toward homelessness. No single policy stops it, but decades of evidence point to a short list of levers that do, working together in three families. The tiers below rank documented effect size and speed, not standalone sufficiency. Washington already holds the strongest of these tools; the danger is that it is not using them fully even as the pressure rises. A serious strategy braids them, and the window to do so is narrowing.
The levers grouped by Protect · Preserve · Produce, placed along the path from missed rent to lost home.
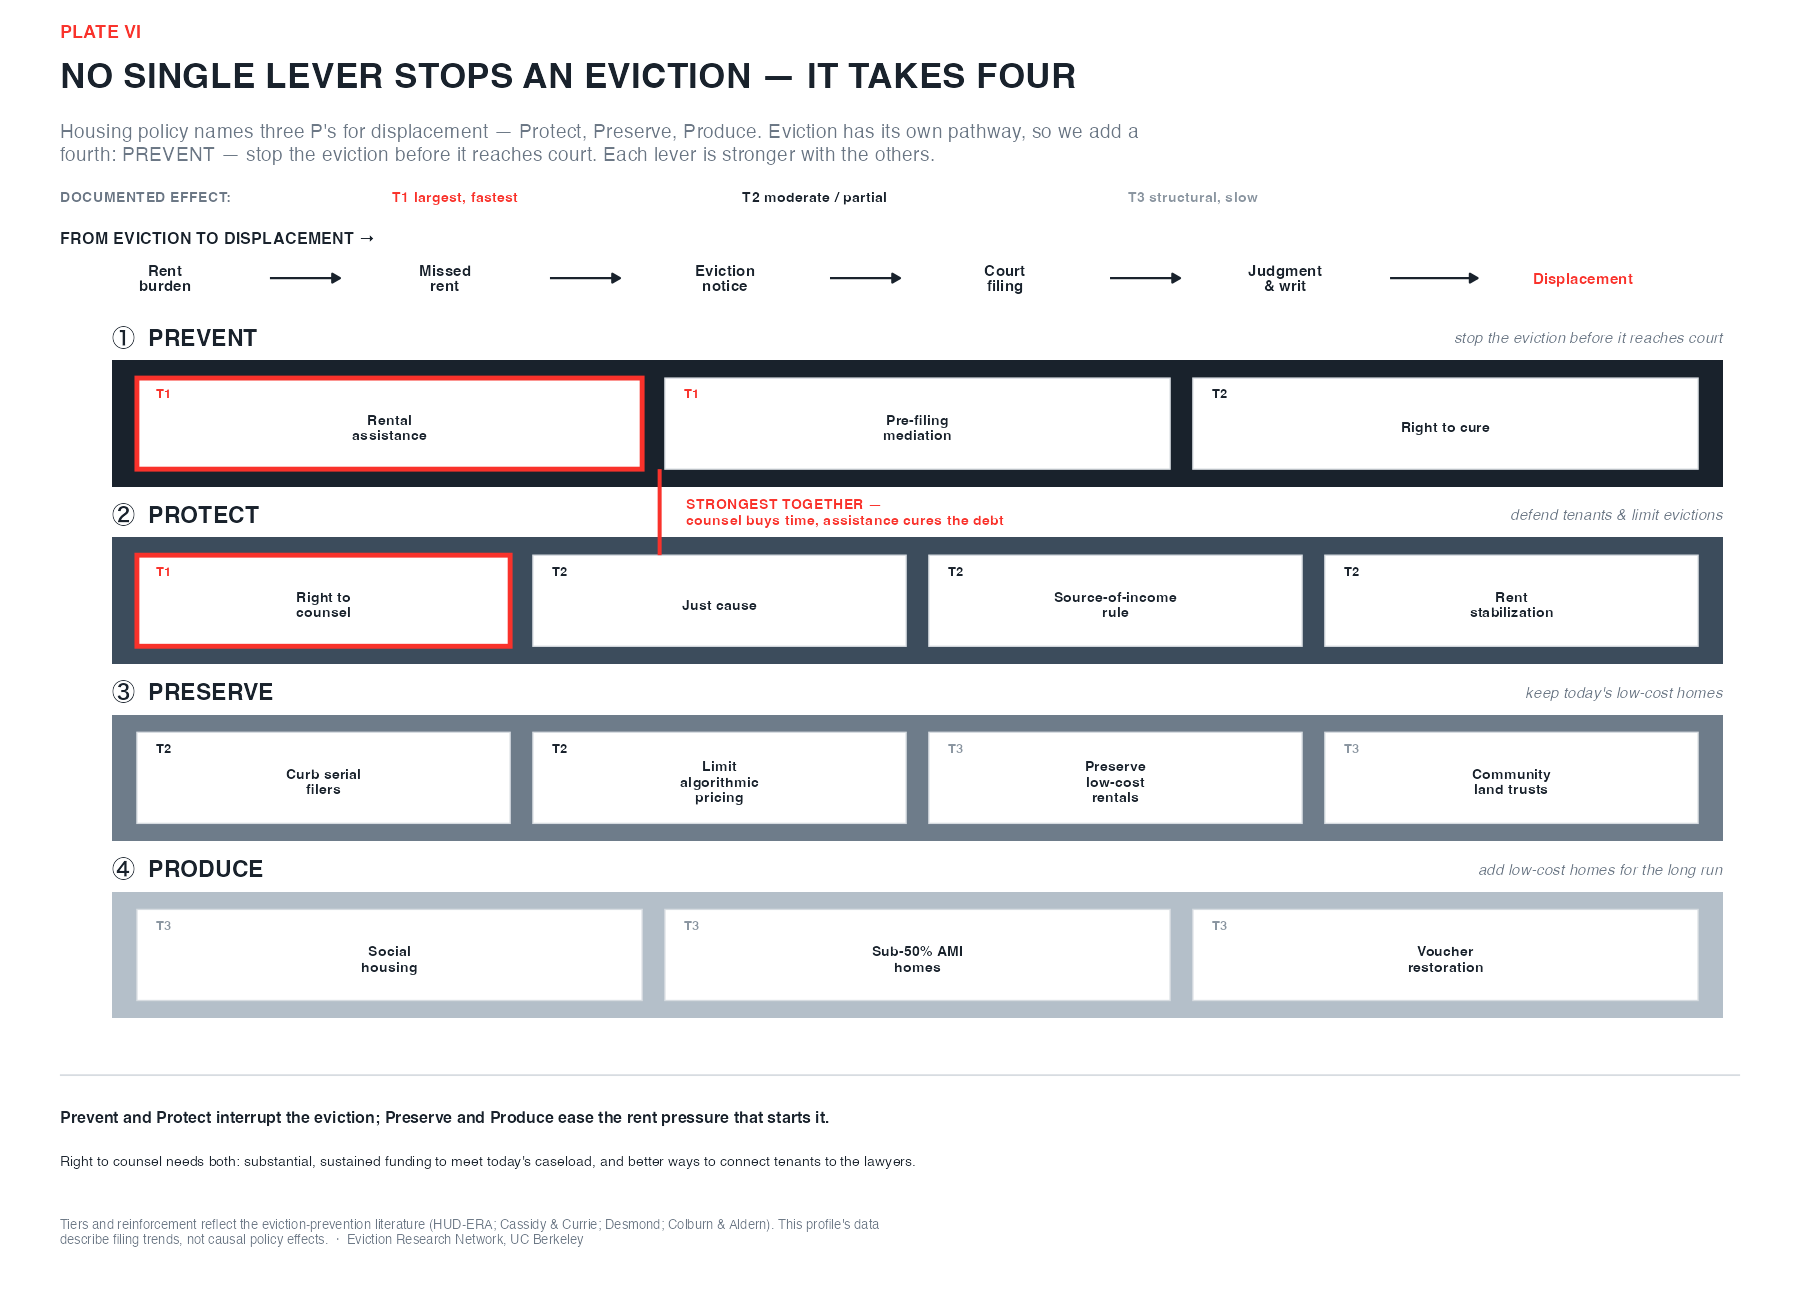
① Protect renters now: the front line, where the evidence is strongest.
② Preserve the homes that exist.
③ Produce new low-cost supply: the durable foundation.
The cost-benefit literature for these levers is real but fragile: most estimates are transported from New York, LA, or Philadelphia, and many double-count avoided shelter costs. Treat any single ROI with at least ±50% uncertainty.
| Lever | Cost | Documented effect | Plausibly net-positive where… |
|---|---|---|---|
| Right to counsel | ~$23K per case (NYC; ~$8.8K per represented person) | −62% possessory judgments (NYC); better outcomes in WA | high-shelter-cost cities (Seattle qualifies) |
| Pre-filing mediation | per-case cost not well established | ~75% reach agreement (Phila); WA ERPP 78% settled | strong court + nonprofit partnership |
| Rental assistance | $6K–$10K per household | 35–53% fewer moves; 60–65% less street homelessness | crisis periods; large downstream value |
| Just cause | $0 fiscal | small on no-cause; ~0 on nonpayment | already in WA |
9 · What we still don't know
The largest documented prevention effect, rental assistance, has no Washington-specific estimate. Washington holds the pieces to build one: Treasury ERA disbursement records, the court filing panel used here, and renter denominators. A dose-response study linking dollars to filings, county by county and month by month, is the single highest-value analysis on the table. A close second is a formal evaluation of Washington's own right-to-counsel and mediation programs against filing volumes; the data exist with the Office of Civil Legal Aid and the Administrative Office of the Courts.
Everything in this paper is a screening result and a literature synthesis. The point of naming the gap is that Washington is unusually well-positioned to close it.
Appendix A · Methods & data
Court records (the outcome). Washington and Minnesota county-month unlawful-detainer (UD) filing counts, 2016–2026, with renter-household denominators from the American Community Survey. A national extract (Legal Services Corporation counties, through May 2023) adds 1,243 more counties for the cross-section; Washington is not in that national source, and Minnesota's rows in it are dropped to avoid double-counting with its court panel.
Joined predictors. ACS 5-year demographics and housing (renter share, median rent, income, poverty, race/ethnicity shares, child share, rental vacancy, severe rent burden, single-family-rental share, population density), Apartment List county rent, and 2020 county presidential returns. Renter denominators are ACS-based throughout, so cross-source rate comparisons are not biased by the denominator, only by how each source defines a "filing."
The modeling panel. 8,802 county-year observations, 1,369 counties, 2016–2025. The headline cross-section is 2022 (N = 1,291 counties, 29 states); a change model uses 126 Washington + Minnesota counties (2018–19 → 2024).
BART (Bayesian Additive Regression Trees, dbarts): outcome log(filings_per_renter + 1e-4); 4 chains × 2,000 draws × 200 trees; importance via tree-inclusion, normalized to a uniform baseline of 1/17 = 0.059. Random forest (ranger, 1,000 trees, permutation importance). OLS with z-scored predictors. Fit, bootstrap importance (30 resamples), and the King benchmark come from a strengthening re-analysis.
Seasonal decomposition for the monthly question: seasonal index from 2017–2019 means; expected = (trailing-12 ÷ 12) × seasonal_index; residual = filings − expected. Crude but adequate for ranking monthly surprises.
Appendix B · Glossary
Appendix C · Sources & citations