Delaware Eviction Filings
Choose different map time periods above.
![]() Data collected by: Dan Bernstein @Legal Services Corporation - Civil Court Data Initiative
Data collected by: Dan Bernstein @Legal Services Corporation - Civil Court Data Initiative
Analysis by: Xin (Jennifer) Chen, Julia Greenberg, Hannah Moore, Amit Cohen, Tim Thomas @U.C. Berkeley’s Urban Displacement Project
Updated: December 7, 2022
Summary
- Between the beginning of the pandemic in March 2020 and the end of 2021, almost 10,000 evictions were filed in Delaware.
- Most evictions occurred in South Wilmington & mostly Black or racially & ethnically diverse neighborhoods.
- Eviction rates fell close to zero in the early months of the pandemic, rose to 50% of the historical average through the CDC moratorium in September 2020, but returned close to normal by March 2022.
- In 2021:
- 1 in 17 renters overall experienced an eviction filing (5.8%).
- 1 in 15 Black renters (6.8%).
- 1 in 19 Latine and White (5.2% & 5.3%).
- 1 in 52 Asian renters experienced an eviction filing (1.9%).
This state profile analysis is a collaboration with the Legal Services Corporation. To learn more about the data we used and how we created these maps and plots, see our methodology page.
Moratoria greatly reduced evictions
Cases over time
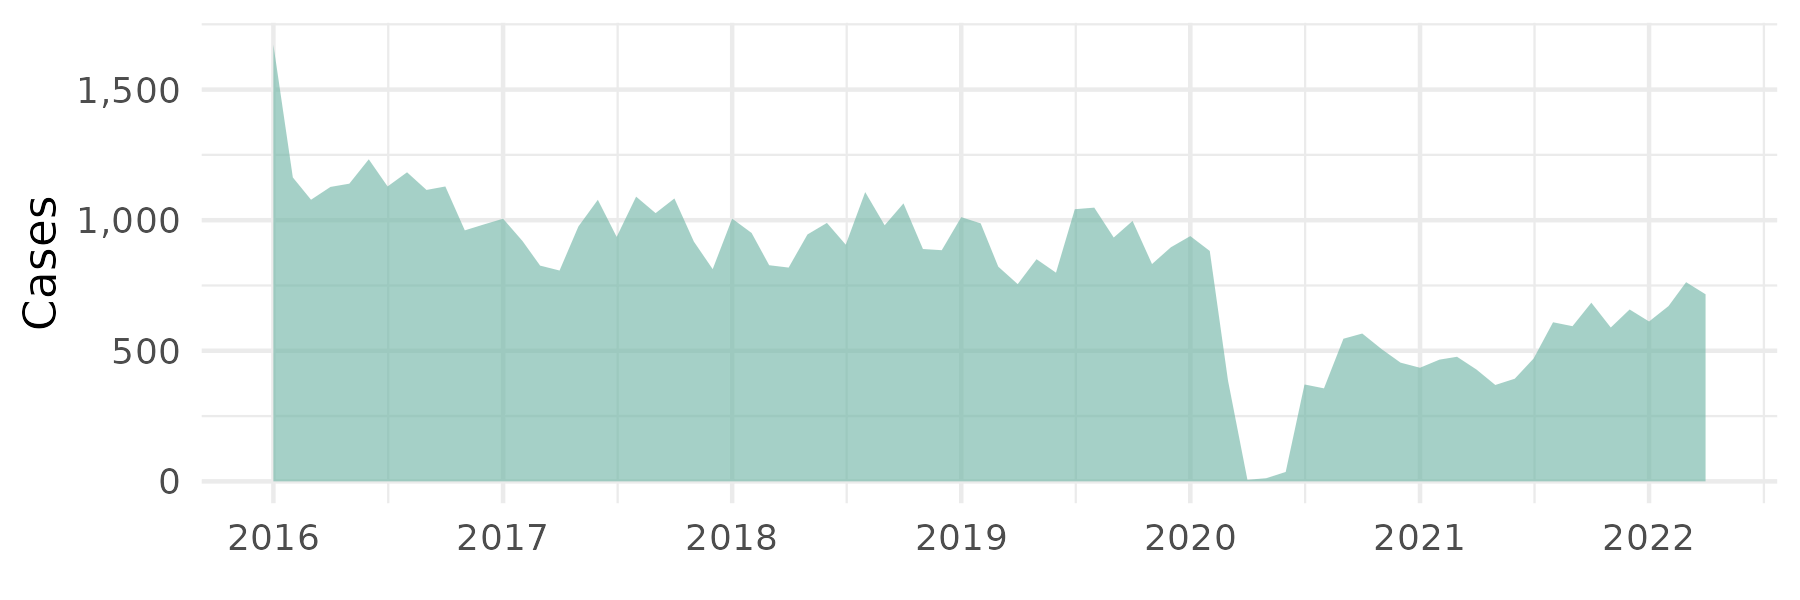
Desktop users: To filter by county, click on its name once. To zoom in on the plot, click and drag to select the area you wish to zoom in on. To reset the plot, double click anywhere inside of it.
The graph above shows evictions by county in Delaware from 2016 to 2022,1 with New Castle County (green) experiencing the most evictions at the top and Sussex County (blue) experiencing the fewest evictions at the bottom.2 The graph shows that in all counties, evictions dropped sharply after the first eviction moratorium in March 2020, but started to sharply increase in the latter half of 2021.
Note that data is updated as recent case information becomes available.
Eviction counts are reaching historical average
PANDEMIC EVICTION CASES VS. HISTORICAL AVERAGE
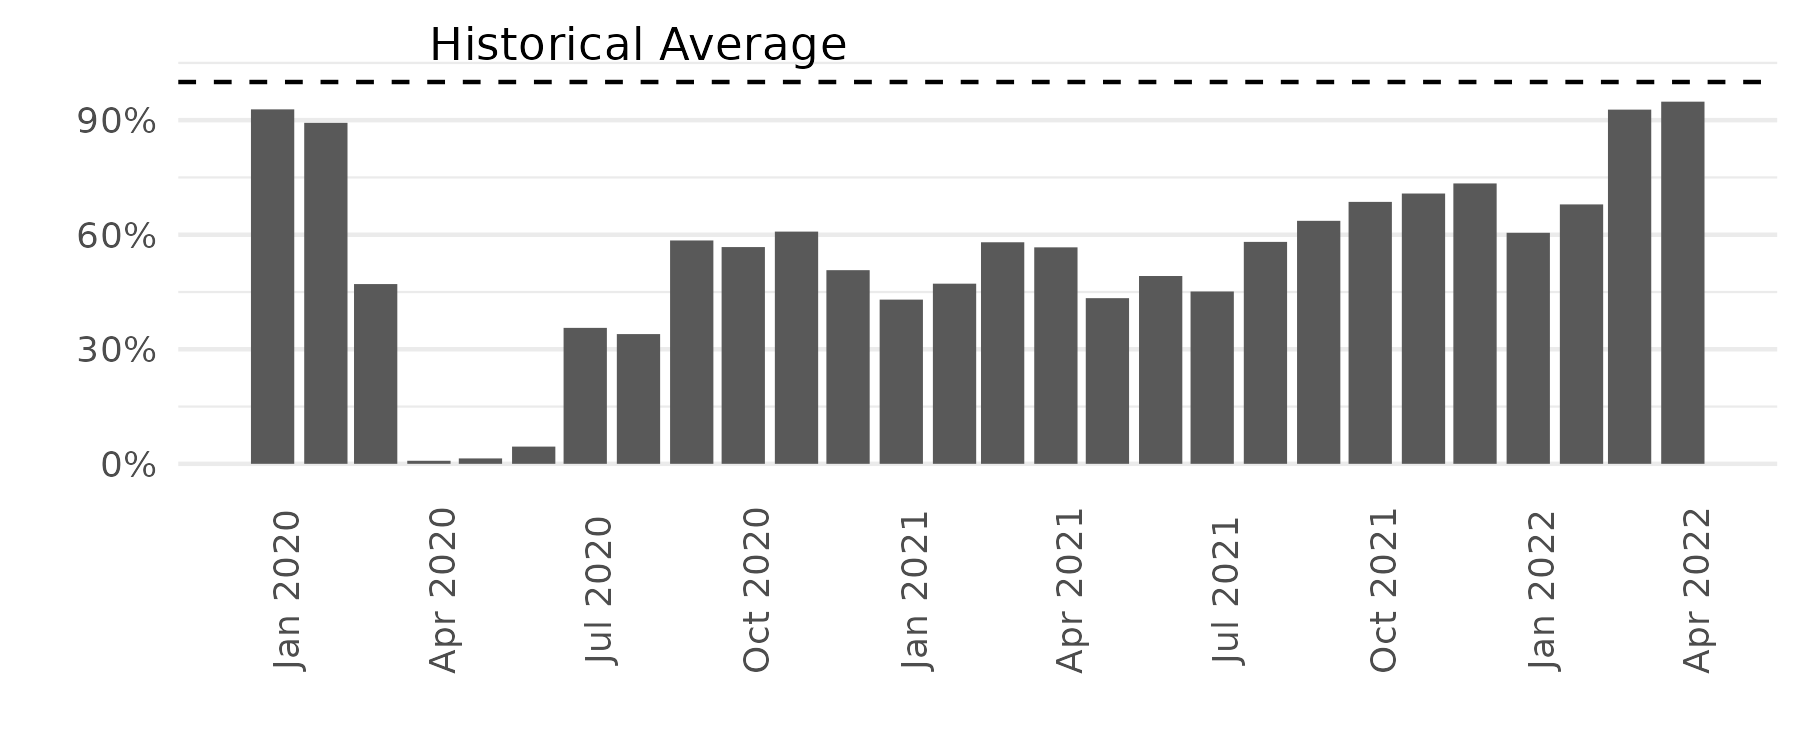
Before the pandemic, eviction rates remained close to the historical average. In April 2020, rates dropped to near 0% of historical average and reached to about 64% below the historical average in July 2020. Rates gradually increased to about 25% below the historical average through the following months. By March 2022, filing rates had almost returned to the historical average.
Black renters are disproportionately evicted
Eviction case rate by race
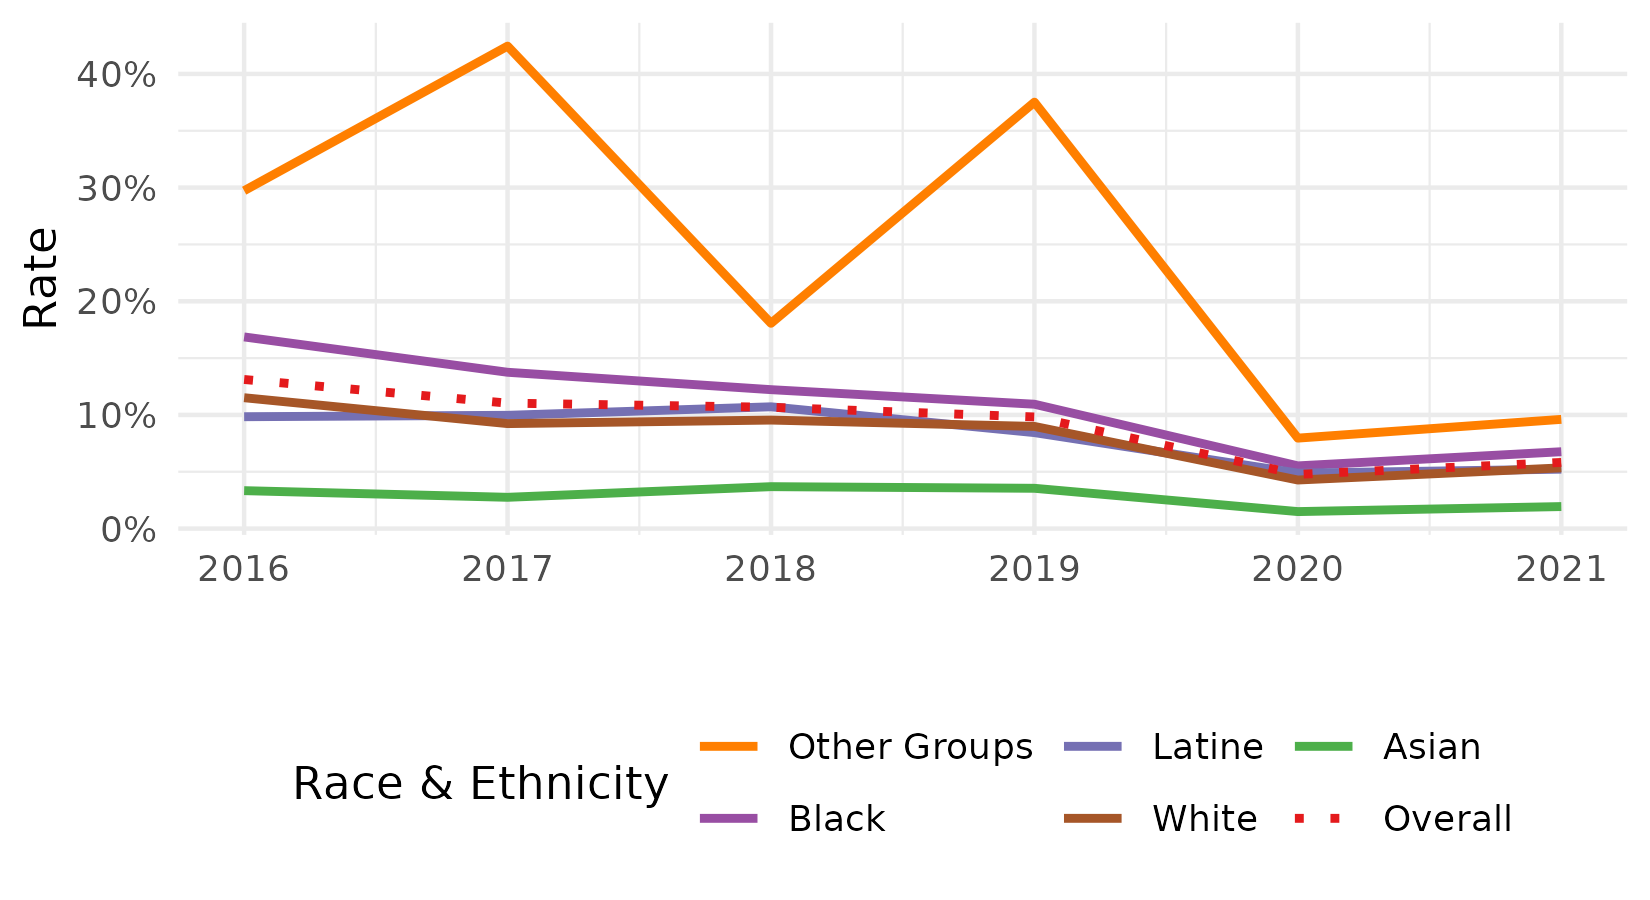
Eviction filing rates between 2016 and 2021 were consistently highest among Black renters.3 In 2016, 1 in 6 Black renters had an eviction filing, which decreased to 1 in 9 by 2019. During the pandemic, roughly 1 in 15 Black renters had an eviction filing. These filing rates were above the overall rate and about two to five percentage points above other racial groups.
Black & Latine filing rates were higher than White
Asian, Black, & Latine eviction filing rates compared to White eviction filing rates
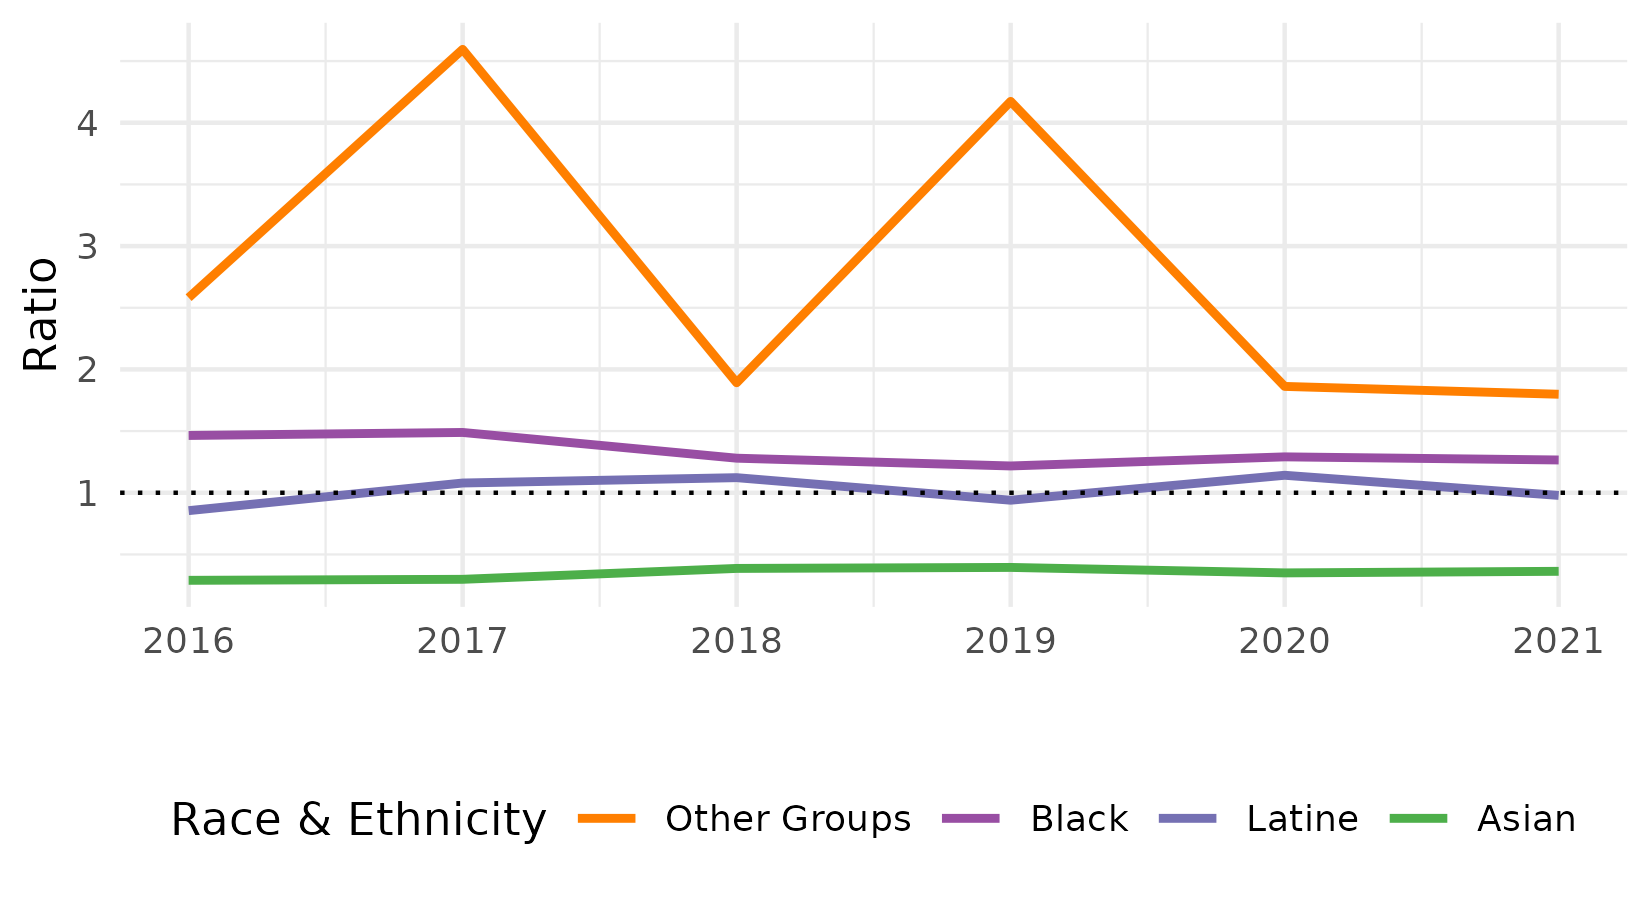
This graph shows the difference in eviction rates of Asian, Black, and Latine renters compared to the estimated eviction rate for White renters. A ratio greater than 1 (dashed line) means that there is a greater eviction filing rate for non-White renters than White renters. A ratio less than 1 means the opposite - there is a lower eviction filing rate for non-White renters than White renters.
Black renter eviction rates were consistently 20% to 40% higher than White eviction rates across our study period. The Latine eviction rate fluctuates mildly above and below a ratio of 1, meaning that eviction rates are generally similar to White renters, while the Asian to White eviction ratio remains consistently low (around 0.2 - 0.3).
This page will continue to be updated with new data and content. Follow us on twitter @EvictionNet for these updates.
Data table coming soon
1. For the purposes of this report, '2022' ends with April 2022. There is still time left in 2022 for these yearly average rates and ratios to change, and trends that are observed now may be quite different by December.↩
2. Because we analyze eviction filings, we are likely underestimating the number of households that were forced to leave their home. An eviction filing marks the point at which formal eviction proceedings have begun. However, households may leave their home at many different points in the eviction process. For example, some leave after receiving an eviction notice but prior to the eviction filing. Others who are threatened with an eviction leave even earlier, before receiving a notice (these cases are known as "illegal evictions"). Alternatively, not all eviction filings lead to a removal, as some renters work out a deal with their landlord that allows them to stay in their homes. We are not currently able to track this information given the limited nature of our data; however, we are working on potential solutions.↩
3. The race/ethnicity of each individual defendant is estimated using their last name and the racial composition of the census tract where they lived. Because the majority of census tracts in the state are 'mostly White' (see the segregation map layer above), some non-White individuals may have been mis-categorized as White if they lived in tracts with high White populations. Therefore, these plots show a conservative estimate of the racial disparity in eviction cases because we are likely overcounting evictions among White renters and undercounting evictions among non-White renters.↩