Indiana Eviction Filings
Note: View different map layers by selecting the buttons at the top right of the map. Click on tracts and counties to see pop-ups with more information.
Overview
In collaboration with the Legal Services Corporation, UC Berkeley’s Eviction Research Network and Urban Displacement Project analyzed eviction filings in the state of Indiana from 2016 to 2022.
Here are some of our key takeaways:
- Despite local, state, and federal moratoria, over 88,800 renters had evictions on file in Indiana during the pandemic.
- Eviction filings were low during the CARES Act in late March 2020 to the end of July. However, filing rates rapidly increased to about 80% of the historical average during the CDC eviction moratorium and surpassed the historical average levels in March of 2022.
- 1 in 14 renters in Marion County & Indianapolis had an eviction filing between March 2020 and April 2022.
- In 2021, 1 in 17 renters (5.8%) experienced an eviction filing. Eviction rates were highest among "Other group"1 renters (11.5%) and Black renters (8.8%), and were lowest among Asian renters (1.7%).
To learn more about the data we used and how we created these maps and plots, see our methodology page.
Evictions dropped during CARES Act, but increased despite CDC Moratorium
Cases over time
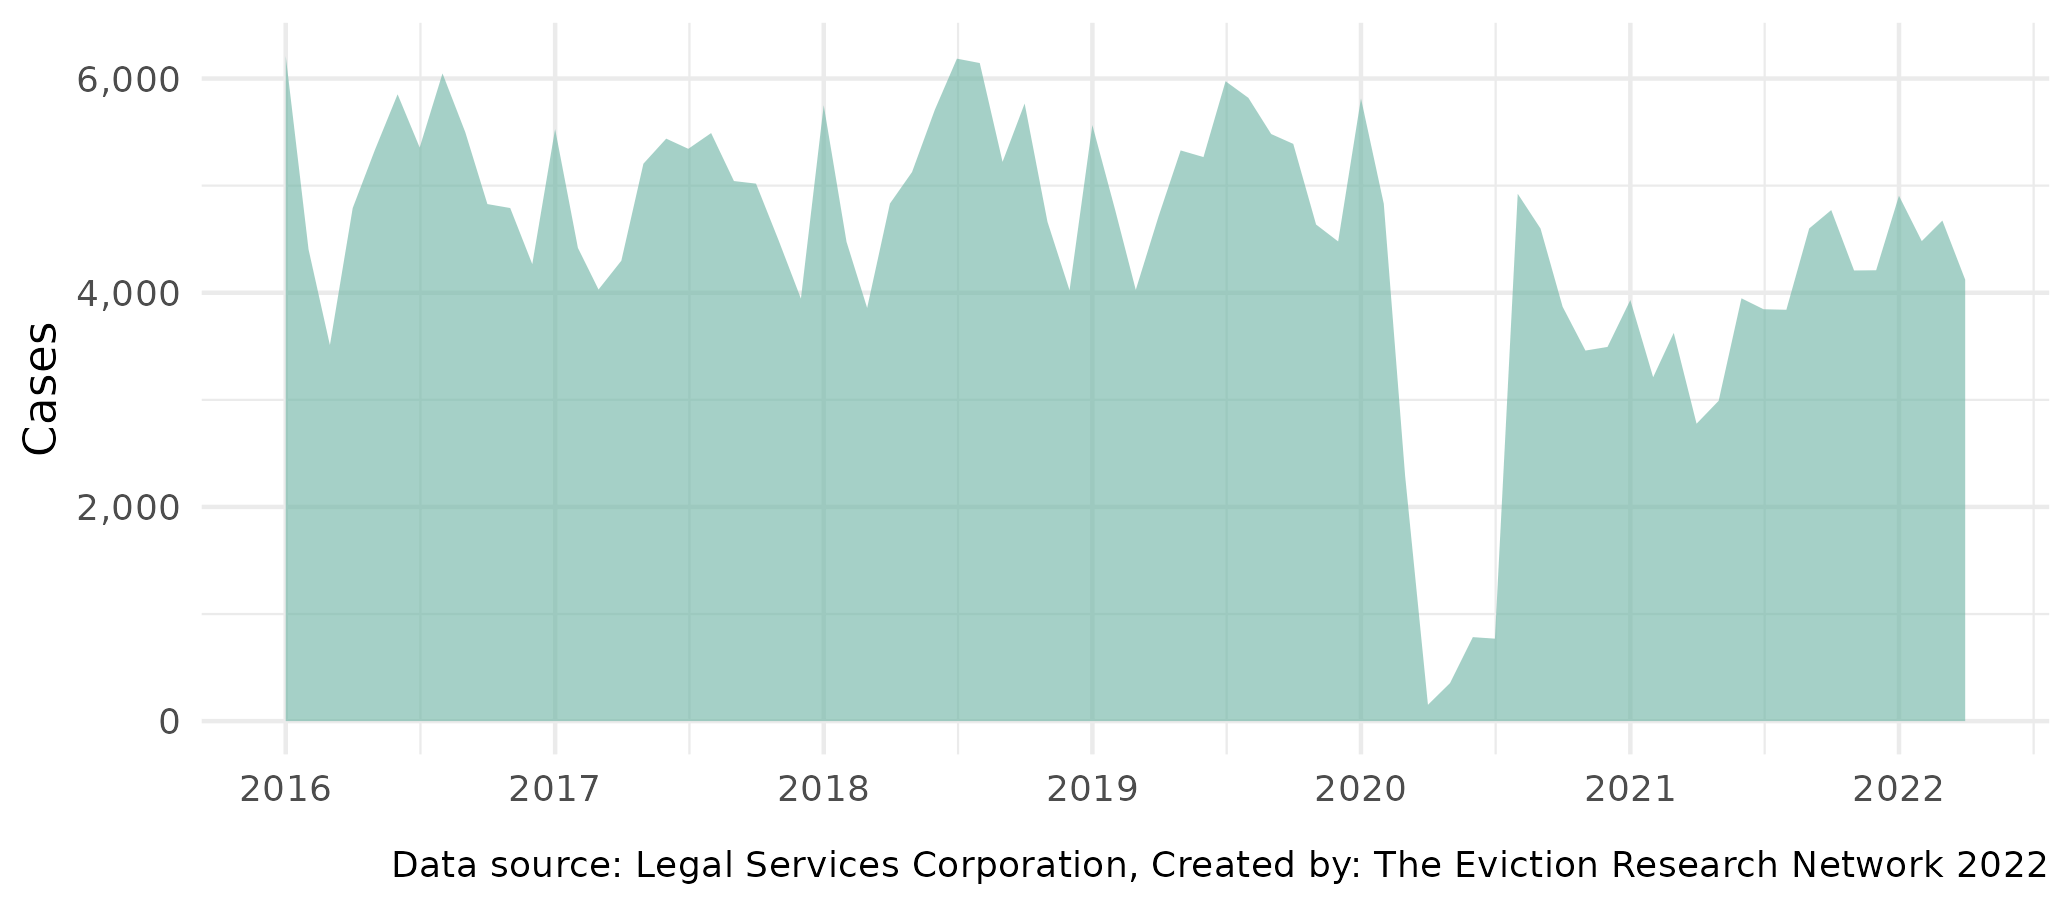
Desktop users: To filter by county, click on its name once. To zoom in on the plot, click and drag to select the area you wish to zoom in on. To reset the plot, double click anywhere inside of it.
The graph above shows evictions by county in Indiana from 2016 to 2022,2 with counties experiencing the highest average evictions at the top and the counties experiencing the fewest average evictions at the bottom.3 Marion County, which includes Indianapolis, had by far the most evictions of any county in the state throughout the entire time period. Evictions in all counties fell sharply in April 2020, when the CARES Act moratorium was implemented, but quickly rose to close to pre-pandemic levels by August, despite the fact that the CDC moratorium was in effect.
Note that data is updated as recent case information becomes available.
Eviction counts surpass historical average in 2022
PANDEMIC EVICTION CASES VS. HISTORICAL AVERAGE
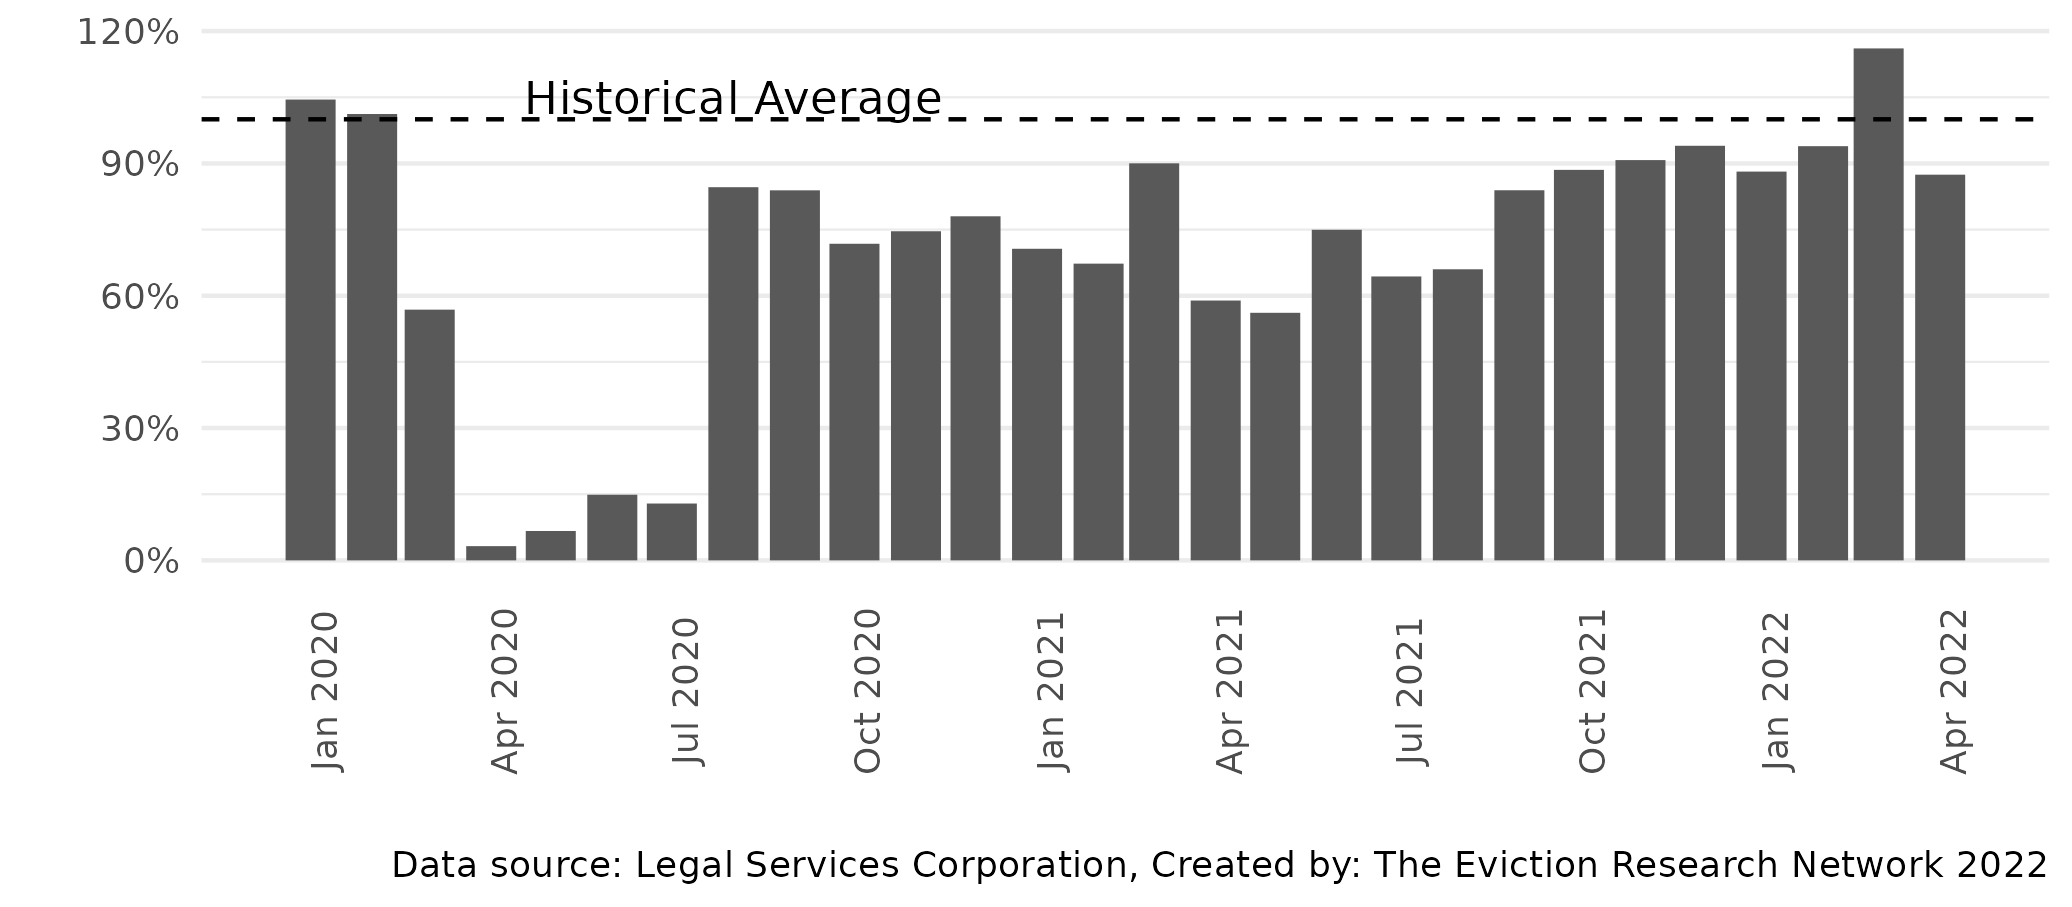
Following the onset of the pandemic in March 2020, when the CARES Act moratorium was put into effect, evictions dropped to 97% of their historical average in April. Rates remained relatively low until August 2020, when they increased to over 75% of historical average levels. Evictions in Indiana decreased very slightly after the CDC moratorium, which was issued in September 2020, and fluctuated through he end of 2021, when they started to approach historical average levels. In March 2022, evictions spiked to 16% above the historical average.
Black and "Other Groups" disproportionately evicted
Eviction case rate by race
Eviction filing rates between 2016 and 2021 were consistently highest among Black renters and renters in "Other Groups".4 Latine and White eviction rates remain close to the average eviction rate throughout the 6 years, while the eviction rate among Asians remains the lowest and the most stable.
All groups see a decrease in eviction rates between 2019 and 2020 (due to pandemic-related restrictions), followed by an increase in 2021 (as levels returned to historical averages).
Asian, Black, Latine, and Other Groups eviction rates compared to White eviction rates
This graph demonstrates the amount by which the estimated eviction rates of Asian, Black, Latine, and "Other Group" renters compare to the estimated eviction rate for White renters. A ratio greater than 1 (dashed line) means that there is a greater eviction filing rate for the non-White group than for White renters. A ratio less than 1 means the opposite - there is a lower eviction filing rate for the non-White group than for White renters.
Black, Latine, and "Other group" renters have ratios greater than 1 while Asian renters have ratios less than 1 throughout the entire study period.
The ratios for each group stay relatively steady throughout the entire period, although there is a slight decrease in the ratio for Black and "Other group" renters starting in 2020. During the pandemic, filing rates among Black renters were 1.79 times higher than filing rates among White renters, and rates among "Other Group" renters were 2.3 times higher.
This page will continue to be updated with new data and content. Follow us on twitter @EvictionNet for these updates.
Data table coming soon
![]() Data collected by: Dan Bernstein @Legal Services Corporation - Civil Court Data Initiative
Data collected by: Dan Bernstein @Legal Services Corporation - Civil Court Data Initiative
Analysis by: Ian Castro, Julia Greenberg, Hannah Moore, Amit Cohen, Tim Thomas @U.C. Berkeley's Urban Displacement Project & Eviction Research Network
Updated: October 18, 2022
1. Individuals considered part of the "Other group" racial/ethnic category in this analysis do not identify as White, Black, Latine or Asian. This category includes, among others, people of mixed race and Indigenous people.↩
2. For the purposes of this report, '2022' ends with April 2022. There is still time left in 2022 for these yearly average rates and ratios to change, and trends that are observed now may be quite different by December.↩
3. Because we analyze eviction filings, we are likely underestimating the number of households that were forced to leave their home. An eviction filing marks the point at which formal eviction proceedings have begun. However, households may leave their home at many different points in the eviction process. For example, some leave after receiving an eviction notice but prior to the eviction filing. Others who are threatened with an eviction leave even earlier, before receiving a notice (these cases are known as "illegal evictions"). Alternatively, not all eviction filings lead to a removal, as some renters work out a deal with their landlord that allows them to stay in their homes. We are not currently able to track this information given the limited nature of our data; however, we are working on potential solutions.↩
4. The race/ethnicity of each individual defendant is estimated using their last name and the racial composition of the census tract where they lived. Because the majority of census tracts in the state are 'mostly White' (see the segregation map layer above), some non-White individuals may have been mis-categorized as White if they lived in tracts with high White populations. Therefore, these plots show a conservative estimate of the racial disparity in eviction cases because we are likely overcounting evictions among White renters and undercounting evictions among non-White renters.↩