Cook County Illinois Eviction Filings
Summary
- Over 6,200 evictions were filed during the pandemic (March 2020 to March 2022).
- Most evictions occurred in mostly Black and Latine neighborhoods in South and West Chicago .
- Eviction rates fell to 5% of the historical average in Spring of 2020, the early months of the pandemic. After the CDC moratorium ended, cases start to rise, resting around 30% of historical average by March of 2022.
This state profile analysis is a collaboration with the ACLU, Legal Aid Chicago, and The National Housing Law Project. To learn more about the data we used and how we created these maps and plots, see our methodology page.
Moratoria greatly reduced evictions
Cook County cases over time
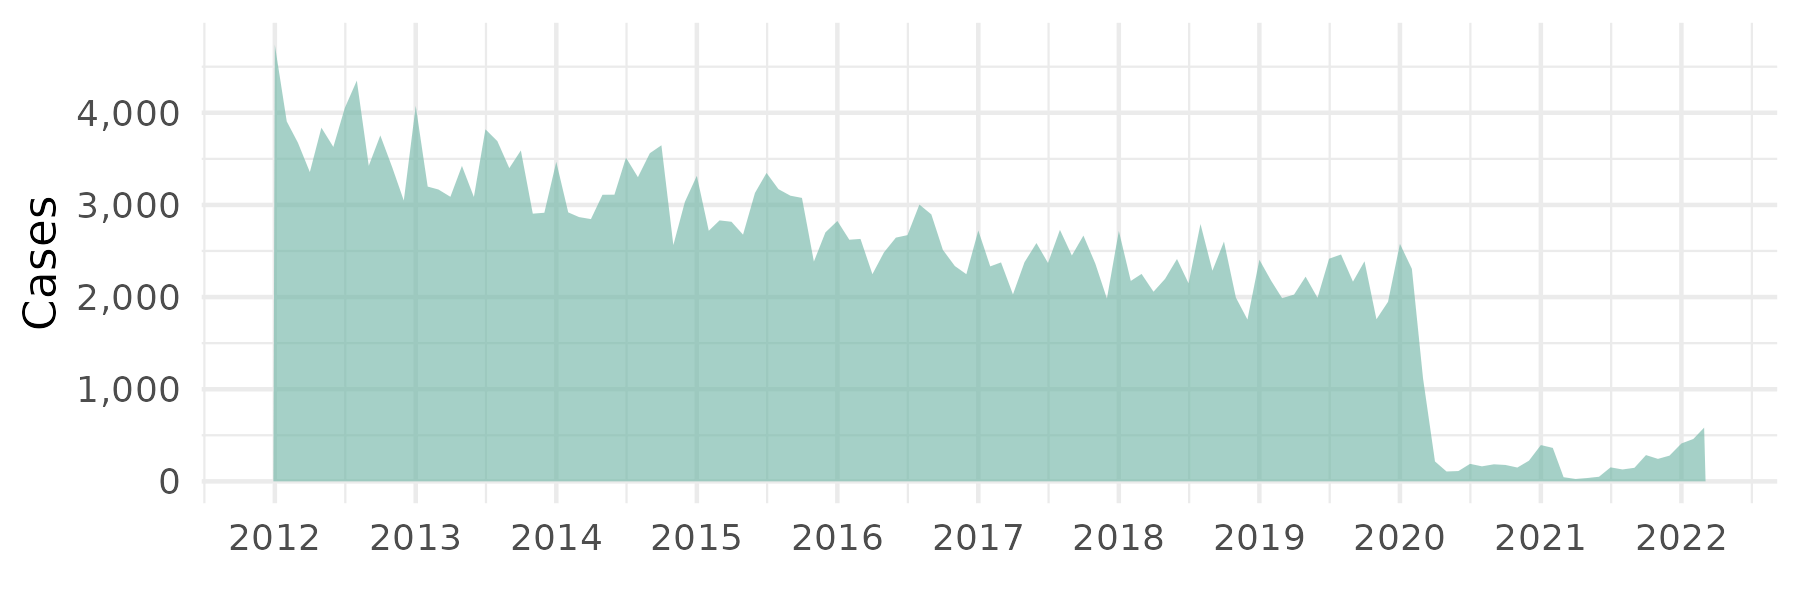
Desktop users: To zoom in on the plot, click and drag to select the area you wish to zoom in on. To reset the plot, double click anywhere inside of it.
The graph above shows the count of eviction filings for Cook County from 2012 to 2022.1,2 The graph shows that evictions dropped sharply after the first eviction moratorium in March of 2020, but started to increase in the latter quarter of 2021.
Note that data is updated as recent case information becomes available.
Eviction counts are increasing after the end of moratoria
PANDEMIC EVICTION CASES compared to the HISTORICAL AVERAGE
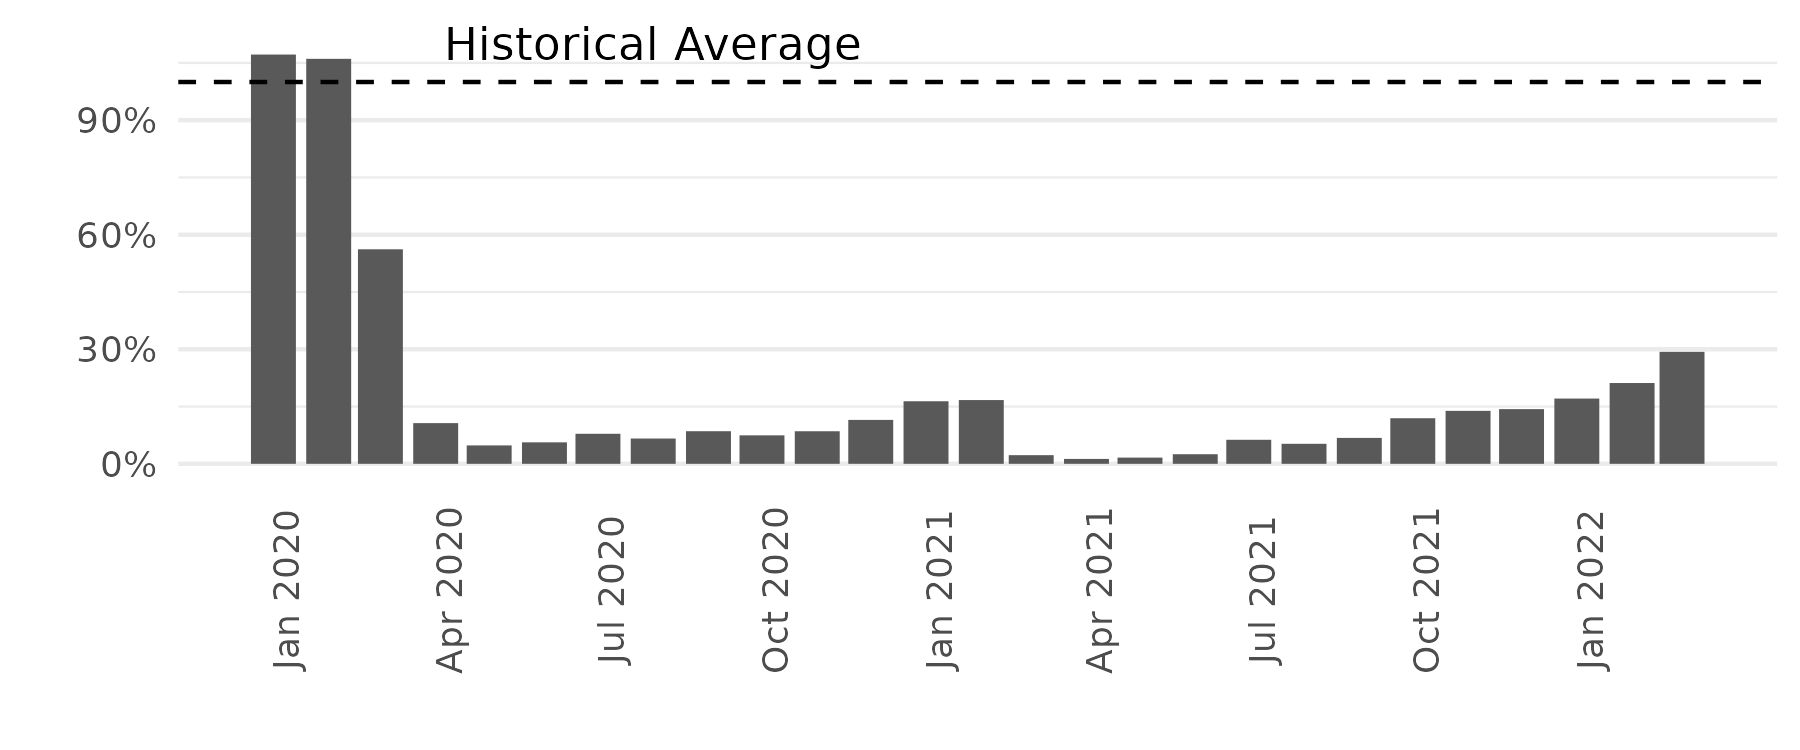
Before the pandemic, eviction rates remained above the historical average. In April 2020, rates dropped to about 5% of historical average and reached to about 17% below the historical average in February 2021. Rates fell to near 1% in March 2021 but gradually increased to about 30% by the end of our data time-frame.
Black renters are disproportionately evicted
Eviction case rate by race
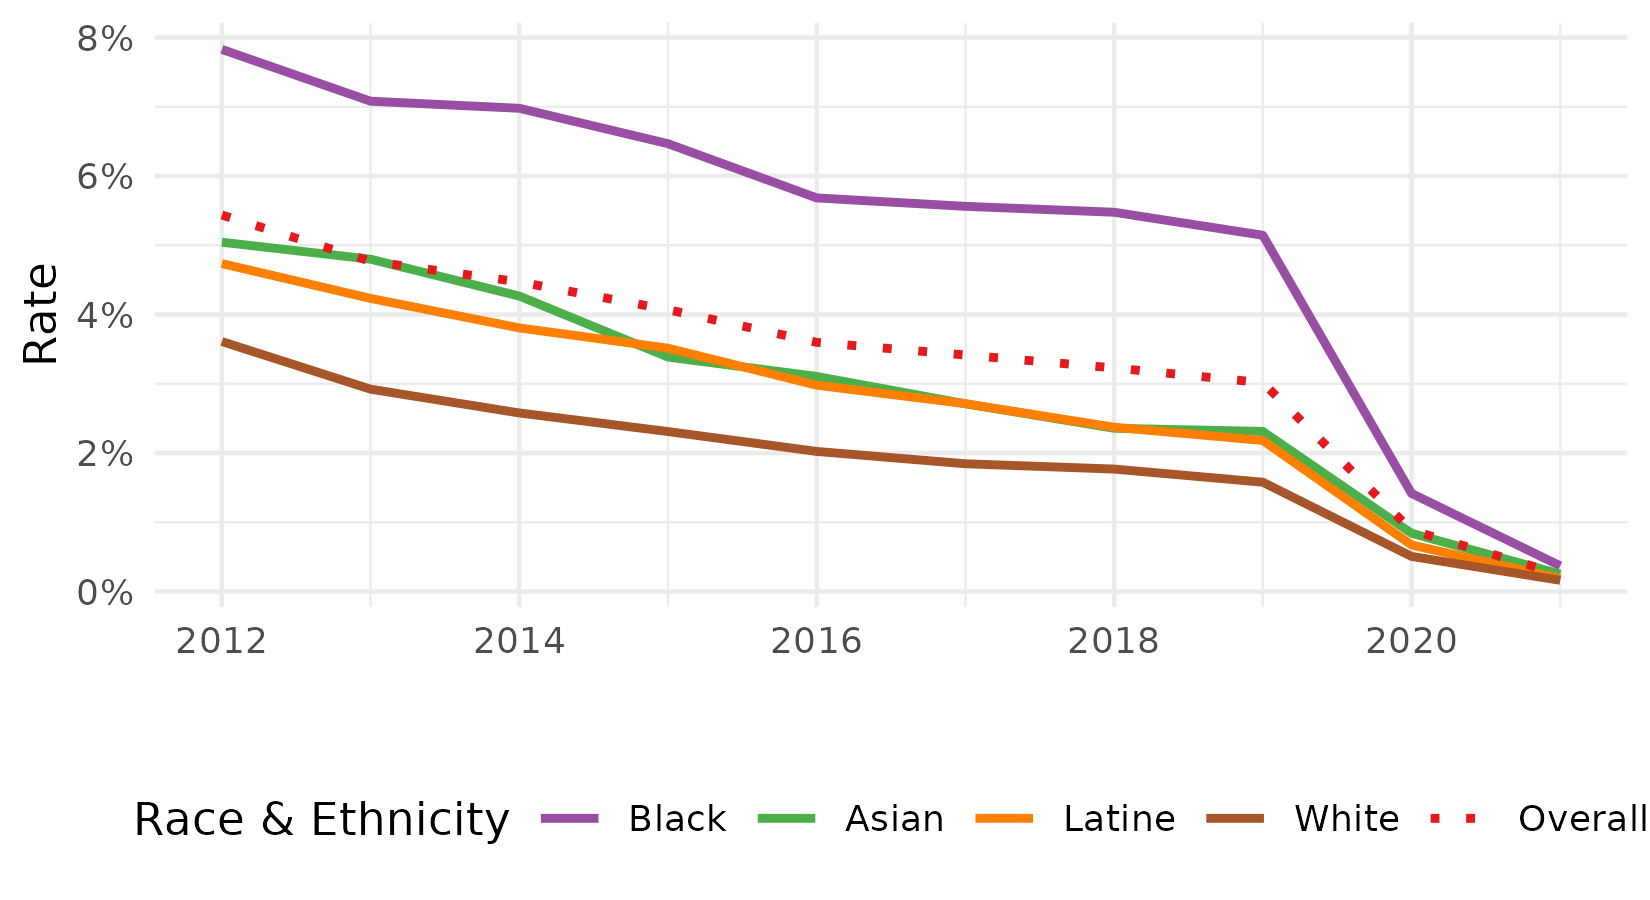
Eviction filing rates between 2012 and 2019 were consistently highest among Black renters.3 In 2012, 1 in 13 Black renters had an eviction filing, which decreased to 1 in 19 by 2019. During the pandemic, eviction rates for all groups fell, however Black renters still had above average rates.
Latine and Asian renter eviction rates were relatively high ranging from 1 in 20 to 1 in 45 evictions per renter. This is the first time in our analysis that we've seen such a high eviction rate among Asian renters.
Black & Latine filing rates were higher than White
Asian, Black, & Latine eviction filing rates compared to White eviction filing rates
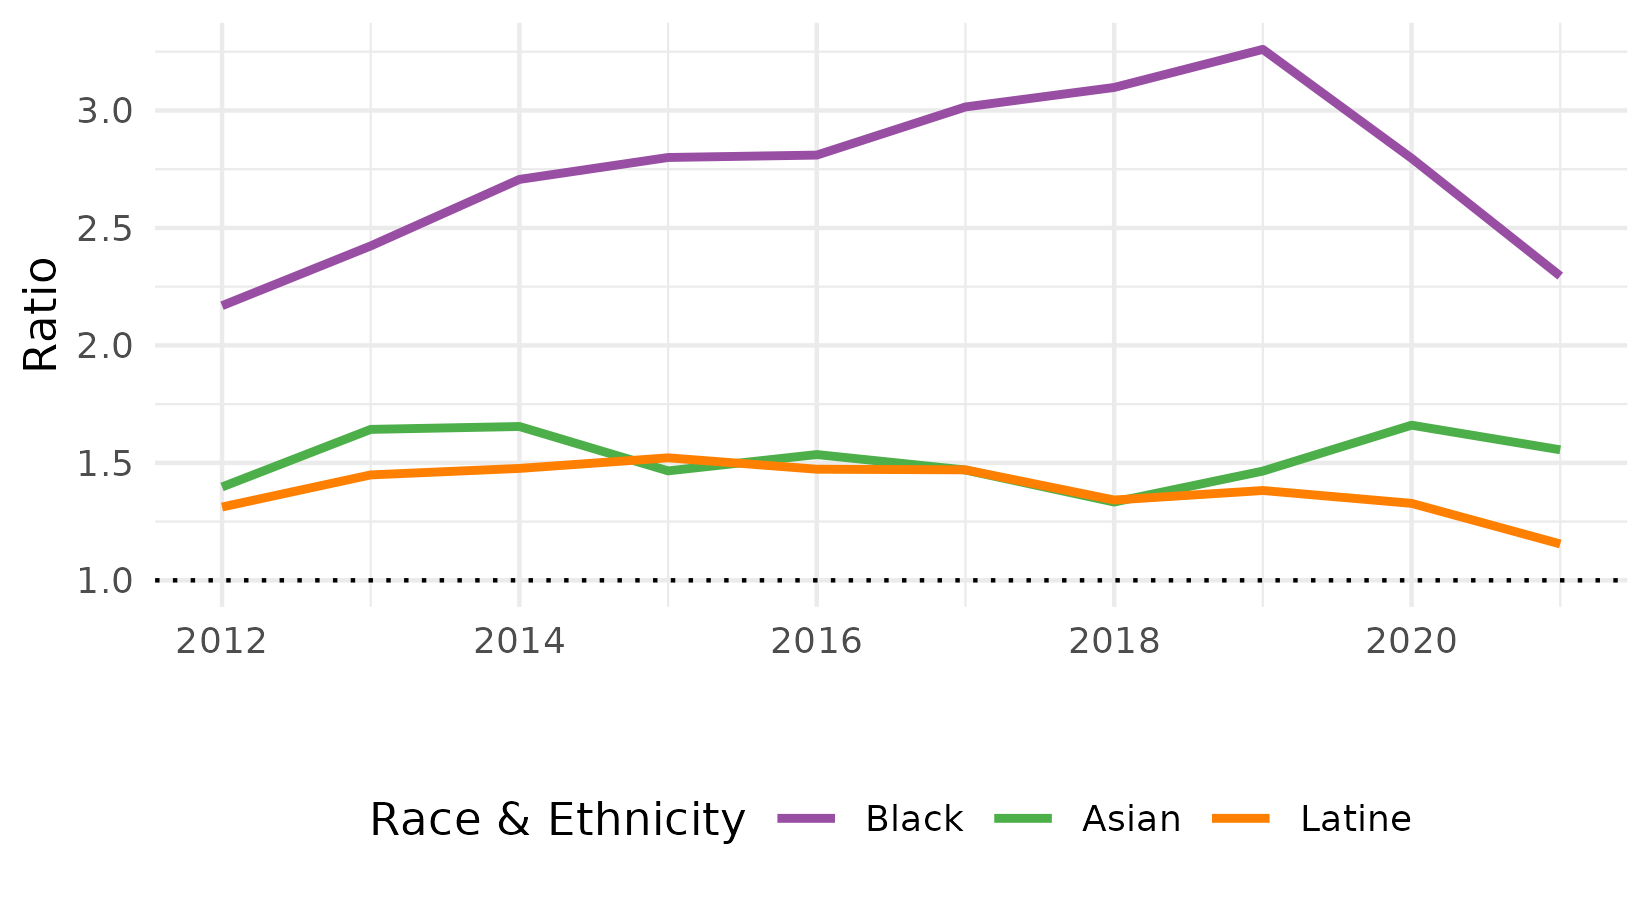
This graph shows the difference in eviction rates of Asian, Black, and Latine renters compared to the estimated eviction rate for White renters. A ratio greater than 1 (dashed line at the bottom) means that there is a greater eviction filing rate for non-White renters than White renters. A ratio less than 1 means the opposite - there is a lower eviction filing rate for non-White renters than White renters.
Black renter eviction rates were consistently 100% to 230% higher than White eviction rates across our study period. The greatest difference occurred in 2019, right before the pandemic, where the eviction rate was 3.26 times higher for Black renters than for White renters. The Latine and Asian eviction rate stayed pretty consistent at 1.5 times higher than Whites (about 50% more) even through the pandemic. The closest that Latine rates got to White rates was in 2021.
This page will continue to be updated with new data and content. Follow us on twitter @EvictionNet for these updates.
Data table coming soon
1. For the purposes of this report, '2022' ends with April 2022. There is still time left in 2022 for these yearly average rates and ratios to change, and trends that are observed now may be quite different by December.↩
2. Because we analyze eviction filings, we are likely underestimating the number of households that were forced to leave their home. An eviction filing marks the point at which formal eviction proceedings have begun. However, households may leave their home at many different points in the eviction process. For example, some leave after receiving an eviction notice but prior to the eviction filing. Others who are threatened with an eviction leave even earlier, before receiving a notice (these cases are known as "illegal evictions"). Alternatively, not all eviction filings lead to a removal, as some renters work out a deal with their landlord that allows them to stay in their homes. We are not currently able to track this information given the limited nature of our data; however, we are working on potential solutions.↩
3. The race/ethnicity of each individual defendant is estimated using their last name and the racial composition of the census tract where they lived. Because the majority of census tracts in the state are 'mostly White' (see the segregation map layer above), some non-White individuals may have been mis-categorized as White if they lived in tracts with high White populations. Therefore, these plots show a conservative estimate of the racial disparity in eviction cases because we are likely overcounting evictions among White renters and undercounting evictions among non-White renters.↩