Washington Eviction Maps (2019)
Between 2019 and the retirement of its Shiny host, The Evictions Study maintained an interactive map of eviction filings across four western Washington counties — King, Pierce, Snohomish, and Whatcom — by year and by race, at multiple geographic scales. The map is no longer live; its methodology is the baseline documented in our 2024 Cityscape paper, and the underlying findings are preserved on this page.
What the map showed
The Evictions Study Map presented team-collected data as a dynamic, interactive visualization — the prevalence of eviction filings across four western Washington counties (King, Pierce, Snohomish, and Whatcom) by year and by race at multiple geographic scales. Demographic, income, and rent characteristics were layered on to highlight where evictions tend to occur. Our demographic estimates showed a massive racial disparity making evictions a civil rights issue related to contemporary discrimination in housing access and economic inequality linked to the legacies of segregation, policies, and practices directed against persons of color. The end-to-end data pipeline behind these estimates — court-record scraping, address geocoding, Bayesian race imputation, and validation against legal-aid intake data — is documented as a general methodology in Thomas et al., "Estimating Eviction Prevalence Across the United States" (Cityscape, 2024), and is the baseline reference for working with heterogeneous court data in any jurisdiction.
Data were not available for every county in every year; estimates were refined as additional records were processed.
Summary of findings
Over the past decade, research has shown that eviction reinforces poverty and limits housing opportunities for the nation's most economically vulnerable. The mark of an eviction sets households on a path of housing insecurity that can prevent them from living in better neighborhoods, establishing beneficial networks and economic opportunities, and is one of the leading indicators of future homelessness.
Based on our race estimates, we find that eviction disparately impacts households of color, particularly adults who are Black. In Pierce County, about 7% of the population is Black. However, 1 in 6 Black adults (18% of the Black adult population) were named in an eviction filing from 2013 to 2017. One in eleven Black adults were named in King County.
What this map offered
The map showed the relative risk of an eviction for different racial groups within neighborhoods in Whatcom, Snohomish, King, and Pierce counties. At the county level it featured all eviction filing counts for the entire state (race estimates were not available at the county level). King County tract- and municipality-level data were limited to 2006, 2010, 2011, 2013, and 2017; Snohomish County tract and municipality data were missing for 2011 and 2012 due to limited access to those records. For each year, tract-level eviction data covered an average of 85% of all eviction filings — a sample size large enough to provide a realistic estimate of eviction risks and rates.
Overlays for state legislative districts, historical redlining zones, and other census variables related to evictions and housing were also provided.
State- and neighborhood-level patterns
State-level trends
Looking at the Washington State 2017 total count of eviction filings at the county level, Pierce, Cowlitz, and Benton counties have the highest relative risk of eviction — the probability of an eviction filing in a county as compared to the probability of an eviction filing in the rest of the state. Their relative risks of 1.53 to 1.56 means the probability of an eviction filing occurring in one of these counties is 53% to 56% higher than the rest of the state. Counties with risks between 20% to 39% higher are Grays Harbor, Snohomish, Franklin, Columbia, Spokane, and Clark.
Neighborhood-level trends
Examining the 2017 tract relative risk of eviction (the probability of an eviction filing in a neighborhood compared to the probability of an eviction filing in the rest of the region), King County evictions concentrate in southern suburban towns while Snohomish and Pierce counties have concentrations in the urban cores and nearby outskirts of Everett and Tacoma. These areas are also the most racially diverse neighborhoods in these counties.
Examining tract-level changes from 2006 to 2017, King County evictions moved from South Seattle to South King County while Snohomish and Pierce county eviction risks stay relatively stable in place. When you set the "Race of Evicted Tenant" on the map to Black, you can see the greatest risk of eviction in 2006 concentrating in South Seattle while risk in 2017 moved further south. In Pierce County, some of the risk is situated in and around historically redlined neighborhoods.
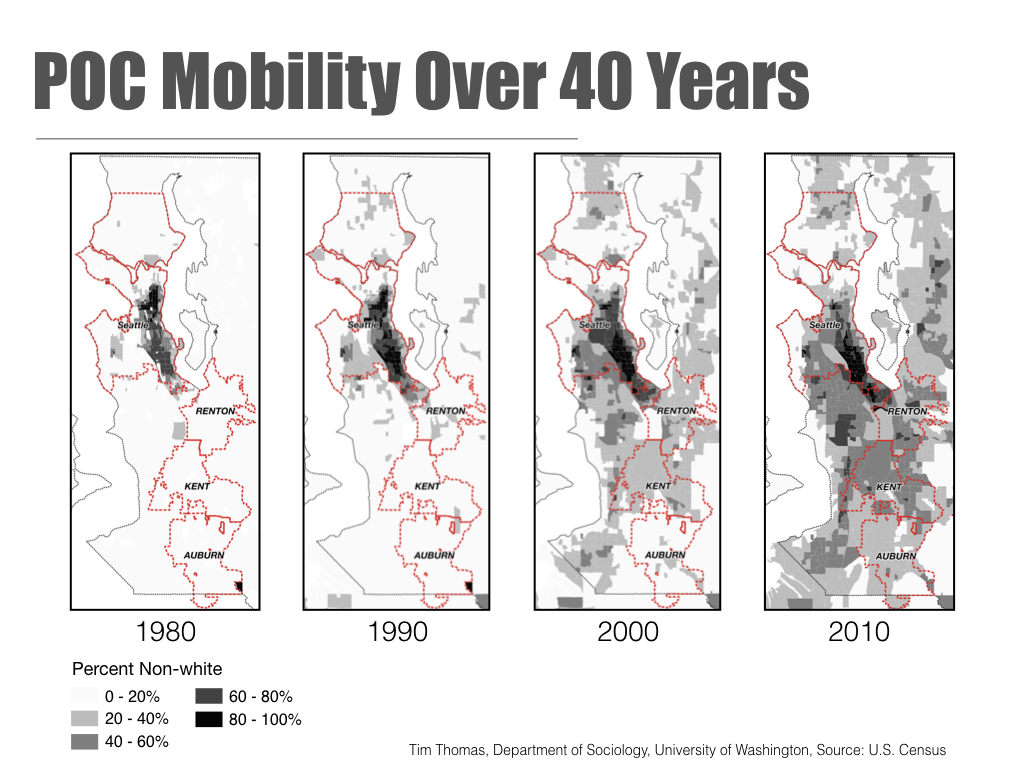
The flow of King County eviction risk moving south also matches the mobility patterns of persons of color over the past 40 years.
Eviction flows following racial mobility patterns is not surprising because of the high rate of evictions among households of color, especially Black households. Our report on Washington State estimates that between 2013 and 2017, 1 in 6 Black adults in Pierce County and 1 in 11 Black adults in King County were named in an eviction filing. This high rate of eviction among Black and Latinx households is not simply due to lower incomes, but rather, it relates to the legacies of segregation that prevented many households of color from purchasing homes and participating in the building of the middle class through historical policies that subjugated and segregated persons of color. The dynamics of persistent urban segregation limit access to better neighborhoods, jobs, and class mobility and are reinforced through discrimination in housing access. As spaces gentrify, rising rents put all low-income renters in those neighborhoods at risk of displacement — especially Black and Latinx households.
What should be done
Given the severe racial disparity in evictions, the consequences of losing your home, rapidly rising rents, and the growing economic divide, we believe several policies should be enacted to protect citizens. Based on our observations of what works in other states, here is a short list to consider:
- Remove no-cause terminations.
- Introduce rent caps.
- Provide navigators to help tenants understand and deal with notices.
- Provide defense attorneys during the legal process.
- Strengthen laws that protect against source-of-income (SOI) discrimination.
- Seal eviction records and prevent them from being used in the rental application process.
Our goal in releasing these maps and reports is to follow in the footsteps of other collective and scholarly researchers and reveal previously unknown patterns of eviction while inspiring more research and discussion on the links of neighborhood change and housing precarity in the United States.
Since 2019
Several of these recommendations have since been enacted in Washington State, most notably the 2019 extension of pay-or-quit notice from 3 to 14 days and the 2021 statewide right-to-counsel program for low-income tenants. For the current evidence base and state-by-state policy tracking, see the research library.
How the map was built
The map used data on eviction filings in Washington State collected by The Evictions Study. Filings were downloaded from the respective County Court Clerk's online portals covering a majority of the years 2004 to 2017. Optical Character Recognition (OCR) software was used to scrape addresses and other information from PDF and TIF versions of court records, which were then geolocated using ESRI and SmartyStreets. For each year, about 85% of all files were geolocated except for several missing years in King County. Counties where less than 60% of all eviction cases were geocoded were not included in the display.
Tenant race estimates were calculated using a Bayesian prediction model developed by Kosuke Imai and Kabir Khanna using the surname and geolocation of the tenant. These imputed estimates produce some uncertainty; our estimates were validated against actual intake data from the King County Bar Housing Justice Project (HJP) and agreed within a few percentage points.
All other data — including renting population, median household income, median rent, rent burden, and poverty rate — originated from the 5-Year American Community Survey (ACS) conducted by the US Census Bureau. The map displayed the five-year estimates ending in the selected year (e.g., 2013–2017 for the 2017 display). 2006–2010 estimates were used for selections before 2010; 2013–2017 estimates were used for 2018.
Eviction rate and relative-risk estimates for a given race were calculated using the estimated number of renting households recorded in the ACS. If fewer than 100 renting households were recorded within any given census geography, or if the margin of error for that estimate was larger than the estimate itself, these values were labeled "N/A." Eviction rate = number of evictions within a census geography divided by the estimated number of renting households. Relative risk of eviction for a given race = the rate of evictions among renting households within each census geography divided by the rate of evictions across the entire study area.
The general methodology
The full, generalized pipeline — from raw court records, through OCR and address geocoding, to Bayesian demographic estimation and validation — is the subject of Thomas, Hepburn, Graetz, and Desmond, "Estimating Eviction Prevalence Across the United States" (Cityscape, 2024). It is the baseline reference for applying this approach to any jurisdiction's court data, in any format. ERN's present-day five-stage pipeline — including updates to the demographic-estimation and deduplication steps since 2019 — is documented on the methodology page.
People and institutions behind the 2019 release
The interactive map interface was created by Alex Ramiller, with app development and web-hosting support by Ott Toomet. Data development and feedback were provided by Tim Thomas, Ian Kennedy, and Jose Hernandez. The Evictions Study would not have been possible without the generous support of Bill Howe and the Cascadia Urban Analytic Cooperative, the University of Washington eScience Institute, the University of Washington Center for Studies in Demography and Ecology, the UC Berkeley Center for Community Innovation and the Urban Displacement Project, Enterprise Community Partners, the King and Snohomish County Bar Association Housing Justice Project, the Washington State Office of Civil Legal Aid, the Law Advocates of Whatcom County, John Stovall, the Public Justice Center in Baltimore, the Baltimore City Sheriff's Department, Professor Malcom Drewery at Coppin State University, Professor Meredith Greif at Johns Hopkins University, and Linda Morris at the ACLU.
The application was built using Shiny and Leaflet, originally hosted on the University of Washington Center for Studies in Demography and Ecology (CSDE) Shiny server. That server is no longer active; the findings on this page are preserved as the 2019 archive, and the methodology is carried forward in the 2024 Cityscape paper.