4 Results
4.1 Eviction Counts
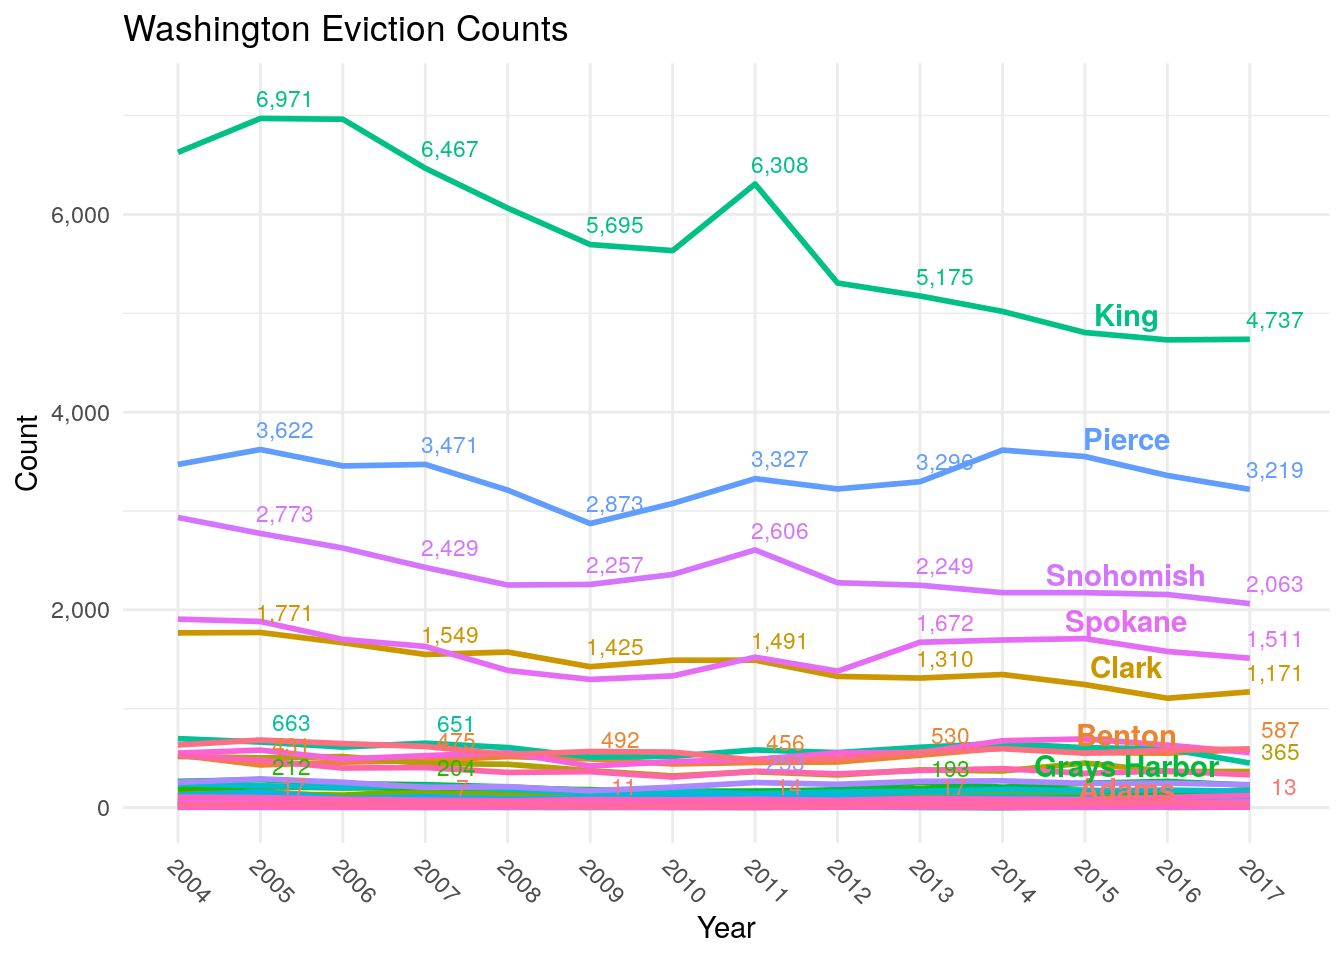
Figure 4.1: Unlawful Detainer Cases by Washington County
Between 2013 and 2017, 1 in 55 (1.8%) Washingtonian adults faced an eviction. Figure 4.1 shows the number of unlawful detainer court cases from 2004 to 2017 across the state of Washington by county. With the exception of King, most counties experienced a steady count of evictions, with the top five most populated counties facing well over 1,000 evictions per year. King (green) saw a peak in evictions just before the end of the Great Recession, which ended around 2009, tapering off during recovery, and then a steady count from 2012.
While the decline in evictions seems promising, a brief study from the Urban Institute suggests that the loss of affordable housing and a drop in the area’s low-income population coincides with declines in evictions. In other words, declines in evictions may be because King County evicted everyone they could.26 Section 5 goes further into this discussion, but in brief, Washington has lost 76,865 affordable homes at $800 or less since 2012, coinciding with an increase in homelessness that matches Great Recession numbers. Given that eviction is a leading cause of homelessness27 28 29 it seems likely that lower evictions might decline when homelessness is high and affordable housing is scarce.
## Warning: funs() is soft deprecated as of dplyr 0.8.0
## Please use a list of either functions or lambdas:
##
##   # Simple named list:
##   list(mean = mean, median = median)
##
##   # Auto named with `tibble::lst()`:
##   tibble::lst(mean, median)
##
##   # Using lambdas
##   list(~ mean(., trim = .2), ~ median(., na.rm = TRUE))
## This warning is displayed once per session.| County | Total | 2004 | 2005 | 2006 | 2007 | 2008 | 2009 | 2010 | 2011 | 2012 | 2013 | 2014 | 2015 | 2016 | 2017 |
|---|---|---|---|---|---|---|---|---|---|---|---|---|---|---|---|
| Adams | 161 | 19 | 17 | 11 | 7 | 6 | 11 | 12 | 14 | 6 | 17 | 8 | 9 | 11 | 13 |
| Asotin | 618 | 58 | 38 | 50 | 30 | 31 | 25 | 41 | 36 | 53 | 36 | 51 | 50 | 67 | 52 |
| Benton | 7,089 | 532 | 431 | 459 | 475 | 516 | 492 | 441 | 456 | 461 | 530 | 603 | 556 | 550 | 587 |
| Chelan | 1,544 | 146 | 166 | 105 | 127 | 120 | 96 | 103 | 102 | 111 | 95 | 108 | 89 | 108 | 68 |
| Clallam | 1,612 | 100 | 99 | 96 | 86 | 90 | 88 | 100 | 125 | 125 | 146 | 157 | 142 | 130 | 128 |
| Clark | 20,237 | 1,767 | 1,771 | 1,667 | 1,549 | 1,573 | 1,425 | 1,490 | 1,491 | 1,327 | 1,310 | 1,346 | 1,244 | 1,106 | 1,171 |
| Columbia | 74 | 3 | 6 | 6 | 4 | 3 | 4 | 3 | 3 | 7 | 8 | 1 | 6 | 8 | 12 |
| Cowlitz | 5,733 | 517 | 502 | 516 | 445 | 438 | 373 | 320 | 362 | 330 | 381 | 370 | 450 | 364 | 365 |
| Douglas | 586 | 65 | 50 | 49 | 48 | 37 | 34 | 34 | 33 | 34 | 40 | 40 | 54 | 43 | 25 |
| Ferry | 48 | 5 | 5 | 4 | 3 | 4 | 7 | 0 | 1 | 4 | 4 | 1 | 2 | 4 | 4 |
| Franklin | 1,953 | 110 | 139 | 126 | 170 | 154 | 151 | 141 | 98 | 114 | 123 | 146 | 155 | 151 | 175 |
| Garfield | 6 | 0 | 0 | 0 | 0 | 0 | 0 | 0 | 0 | 0 | 0 | 0 | 0 | 1 | 5 |
| Grant | 2,522 | 188 | 212 | 198 | 204 | 193 | 181 | 152 | 166 | 160 | 193 | 189 | 175 | 145 | 166 |
| Grays Harbor | 3,107 | 265 | 282 | 242 | 231 | 209 | 170 | 168 | 164 | 180 | 254 | 206 | 246 | 264 | 226 |
| Island | 1,191 | 74 | 81 | 61 | 69 | 71 | 72 | 89 | 102 | 85 | 94 | 100 | 102 | 85 | 106 |
| Jefferson | 466 | 26 | 36 | 35 | 28 | 33 | 34 | 38 | 31 | 23 | 44 | 39 | 34 | 31 | 34 |
| King | 80,503 | 6,628 | 6,971 | 6,963 | 6,467 | 6,064 | 5,695 | 5,634 | 6,308 | 5,306 | 5,175 | 5,019 | 4,805 | 4,731 | 4,737 |
| Kitsap | 8,306 | 697 | 663 | 612 | 651 | 607 | 511 | 518 | 583 | 556 | 610 | 649 | 605 | 594 | 450 |
| Kittitas | 734 | 57 | 57 | 56 | 39 | 32 | 45 | 53 | 58 | 35 | 51 | 48 | 62 | 59 | 82 |
| Klickitat | 44 | 7 | 0 | 0 | 0 | 0 | 1 | 0 | 0 | 7 | 1 | 1 | 0 | 0 | 27 |
| Lewis | 2,536 | 241 | 220 | 206 | 220 | 188 | 141 | 167 | 138 | 157 | 164 | 183 | 170 | 176 | 165 |
| Lincoln | 105 | 5 | 5 | 9 | 10 | 12 | 11 | 5 | 5 | 10 | 6 | 9 | 8 | 5 | 5 |
| Mason | 1,477 | 125 | 157 | 92 | 110 | 90 | 93 | 109 | 111 | 102 | 98 | 107 | 87 | 101 | 95 |
| Okanogan | 500 | 37 | 31 | 28 | 25 | 45 | 37 | 29 | 40 | 42 | 47 | 31 | 26 | 41 | 41 |
| Pacific | 525 | 37 | 70 | 47 | 51 | 25 | 29 | 26 | 30 | 24 | 39 | 37 | 41 | 30 | 39 |
| Pend Oreille | 202 | 13 | 15 | 13 | 17 | 20 | 11 | 13 | 13 | 12 | 13 | 12 | 18 | 15 | 17 |
| Pierce | 46,771 | 3,471 | 3,622 | 3,456 | 3,471 | 3,211 | 2,873 | 3,076 | 3,327 | 3,223 | 3,296 | 3,616 | 3,551 | 3,359 | 3,219 |
| Puget Sound | 181,172 | 14,610 | 14,981 | 14,464 | 13,816 | 12,970 | 11,998 | 12,345 | 13,666 | 12,232 | 12,245 | 12,504 | 12,176 | 11,803 | 11,362 |
| San Juan | 178 | 17 | 19 | 14 | 8 | 9 | 7 | 17 | 12 | 11 | 12 | 17 | 16 | 8 | 11 |
| Skagit | 3,338 | 255 | 290 | 256 | 204 | 211 | 170 | 206 | 253 | 235 | 265 | 270 | 245 | 247 | 231 |
| Skamania | 208 | 14 | 14 | 5 | 10 | 15 | 15 | 12 | 13 | 13 | 20 | 13 | 25 | 16 | 23 |
| Snohomish | 33,322 | 2,934 | 2,773 | 2,625 | 2,429 | 2,251 | 2,257 | 2,358 | 2,606 | 2,274 | 2,249 | 2,174 | 2,174 | 2,155 | 2,063 |
| Spokane | 22,201 | 1,906 | 1,882 | 1,701 | 1,630 | 1,387 | 1,296 | 1,332 | 1,521 | 1,380 | 1,672 | 1,695 | 1,709 | 1,579 | 1,511 |
| Stevens | 619 | 60 | 62 | 23 | 44 | 37 | 29 | 37 | 45 | 37 | 40 | 46 | 55 | 47 | 57 |
| Thurston | 7,741 | 551 | 581 | 491 | 525 | 555 | 420 | 464 | 487 | 553 | 556 | 676 | 694 | 632 | 556 |
| WA No King | 190,955 | 15,596 | 15,594 | 14,428 | 14,056 | 13,171 | 12,143 | 12,531 | 13,385 | 12,636 | 13,480 | 14,059 | 13,825 | 13,237 | 12,814 |
| Wahkiakum | 49 | 3 | 2 | 2 | 2 | 5 | 5 | 2 | 2 | 4 | 6 | 2 | 5 | 5 | 4 |
| Walla Walla | 1,231 | 105 | 101 | 84 | 75 | 68 | 81 | 78 | 84 | 74 | 92 | 85 | 80 | 102 | 122 |
| Washington | 271,458 | 22,224 | 22,565 | 21,391 | 20,523 | 19,235 | 17,838 | 18,165 | 19,693 | 17,942 | 18,655 | 19,078 | 18,630 | 17,968 | 17,551 |
| Whatcom | 5,360 | 526 | 478 | 400 | 405 | 355 | 363 | 308 | 368 | 341 | 375 | 394 | 346 | 370 | 331 |
| Whitman | 460 | 27 | 34 | 36 | 36 | 34 | 18 | 28 | 26 | 29 | 31 | 34 | 44 | 48 | 35 |
| Yakima | 8,101 | 633 | 683 | 647 | 618 | 536 | 567 | 561 | 479 | 497 | 562 | 595 | 550 | 580 | 593 |
4.2 Default Judgments
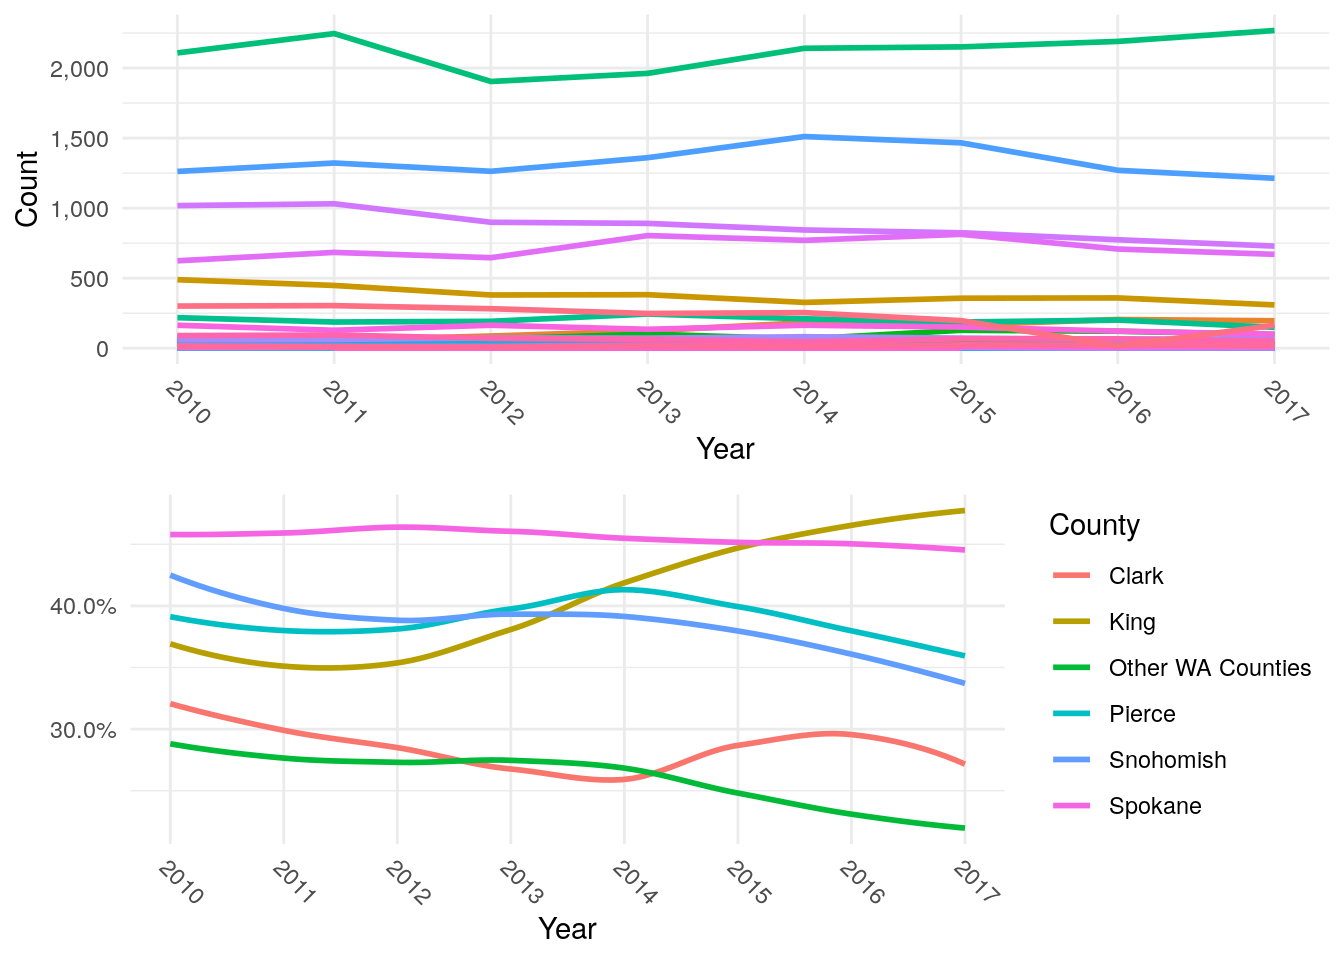
Figure 4.2: Default Judgment Counts and Percents by Washington County
One surprising trend is the number of default judgments (no-shows to court) among unlawful detainers. The figure above shows the count and percent of cases that were default judgments. By count, most occurred during the great recession. However, the percentage of cases that were defaults tells a different story. Spokane County saw a steady trend of about 45% of cases defaulting, while Snohomish, Pierce, and Clark peaked around 45% to 50% in 2006, landing to around 30% and 35% by 2017. King, on the other hand, is above Great Recession percents hovering just under 50%.
The consequence of no-show outcomes almost surely guarantees that the tenant will face the strictest enforcement and costs of an eviction. A recent study in Seattle found that the median court costs for over 1,000 cases in 2017 was $3,129.73, which included owed rent, non-rent charges, and legal costs.30 In addition to the mark of an eviction, these costs compound the already dire consequences of evictions.
4.3 Representation
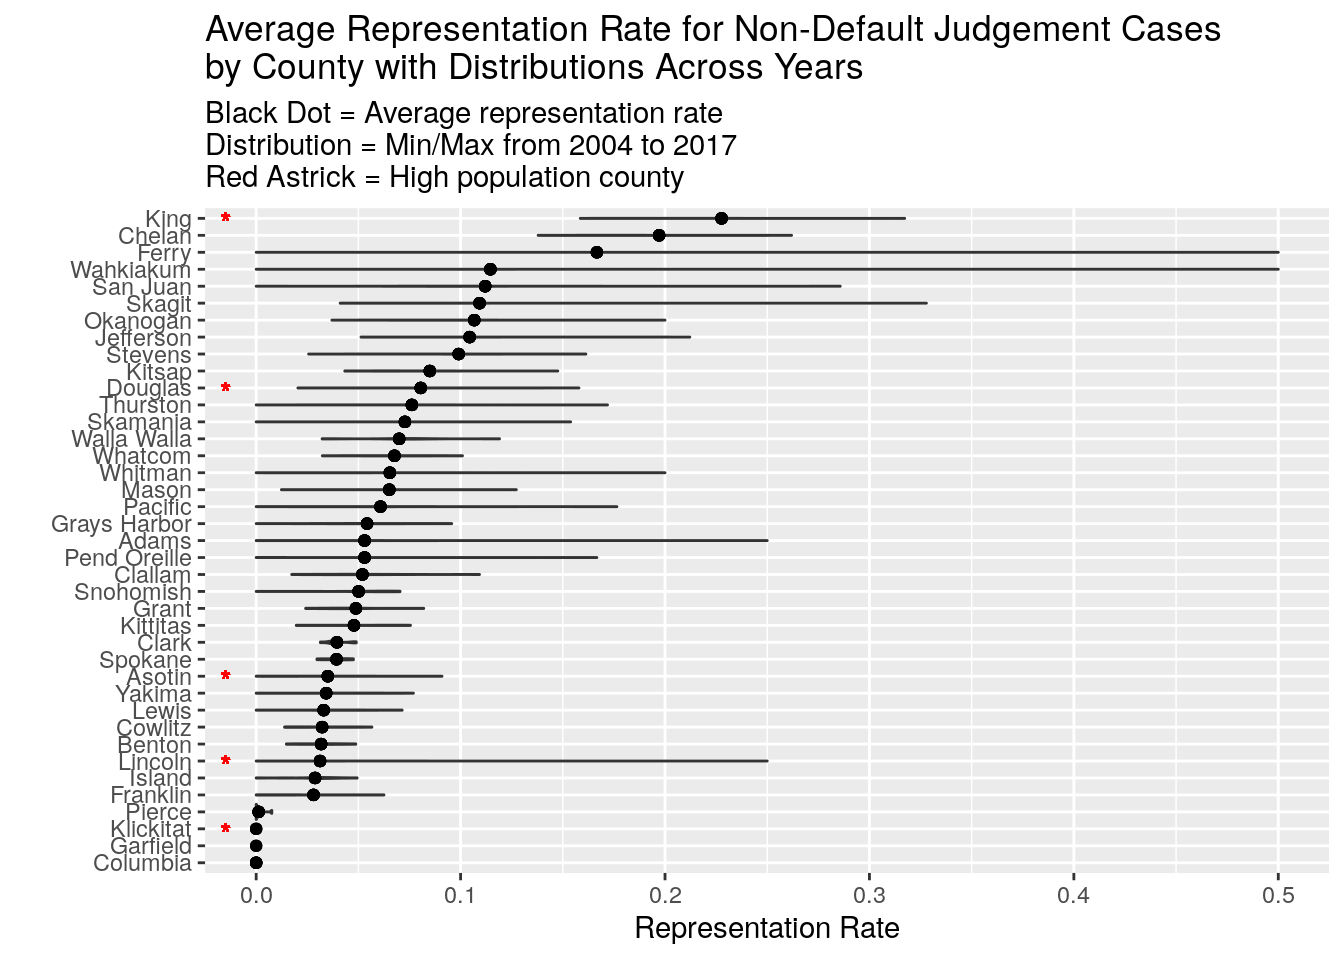
Figure 4.3: Average legal representation for all counties in Washington State from 2004 to 2017
One of the suggestions in helping ameliorate the negative affects of an eviction filing is to have legal representation during the court proceedings. The same Seattle study in 201731 found that defendants that had legal representation were twice as likely to stay in their homes as compared to pro-se representation. Less than 8% of all Washington defendants had an attorney named on their behalf in our data. One caveat to this number is that a named attorney does not equate representation during trial, but rather, there was some attorney working on some part of the case (i.e. not necessarily present before the judge). Realistically, attorney representation at the time of trial would speculatively fall several percentage points below 8% for all defendants. Among all the 39 counties in Washington, only 9 counties had an average representation rate at or above 8%. Figure 4.3 shows the average representation for each county from 2004 to 2017, where black dots represent the average and the density bands show the variation in representation over time. King County had the most representation ranging from under 14% to one time to 33% and an average of about 21%. This high level of representation for defendants may be related to the efforts of volunteer law programs such as the Housing Justice Project that represents defendants on the day of their trial. Regardless, the rates of eviction in King County are still some of the highest in the state. The red dots on the left identify the top 5 most populated counties. As you can see, Pierce, Clark, Spokane, and Whatcom counties still have extremely low representation averages below the state average of 8%.
4.4 Sex of the evicted
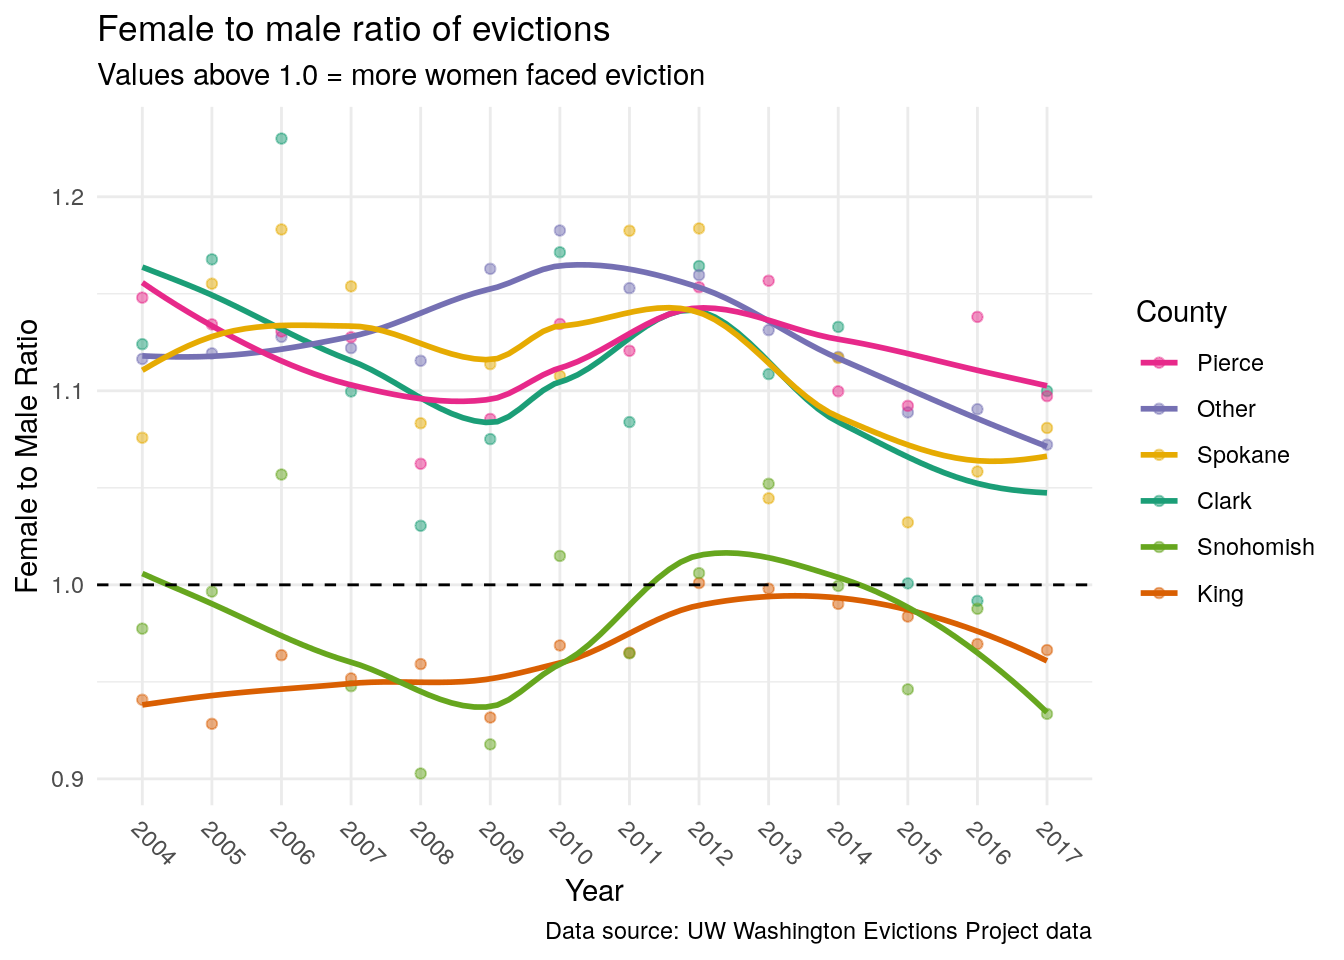
Figure 4.4: Female to Male Ratio in Evictions by WA County
Across Washington state, females were evicted 6% more than males (189,053 females, 178,500 males, and 30,143 unknown).32 However, this distribution is not the same for every county. Figure 4.4 shows the smoothed averages of the female to male ratio of adult defendants. Pierce, Spokane, Clark, and all “other” counties with less than 700 evictions a year (n = 34) have a higher ratio of around 11% more eviction filings for women than men. King County and neighboring Snohomish County have slightly more men evicted than women at roughly 3% on average.
4.5 Race of the evicted
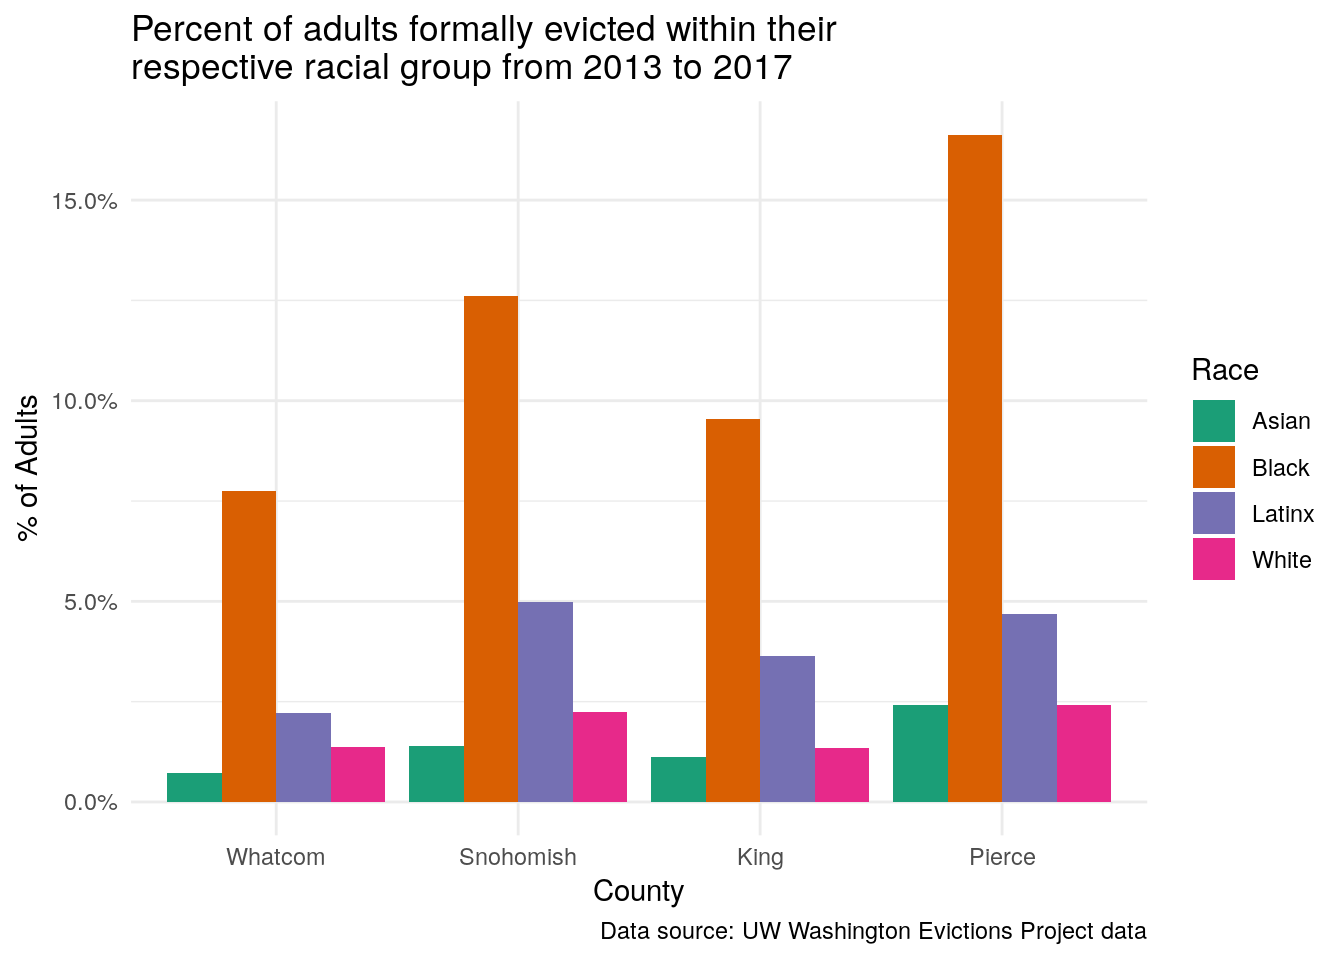
Figure 4.5: Race Differences in Evictions for Select WA Counties
The most troubling results from this analysis is the huge racial disparity of Black adults who faced eviction filings.33 When comparing the court records for three counties to their respective 2012 to 2017 adult population, we find that 9% of Black adults in King County and 17% of Black adults in Pierce faced an eviction within a 5-year period (see Figure 4.5). Whatcom’s Black population is much smaller (less than 1%) than King (5.5%) and Pierce (6.6%) and only faced an eviction rate of 1.4%. Latinx adults, a population close to the proportion of Black adults in these counties (compositions of 7.6%, 8.1%, and 7% respectively), faced much lower eviction rates of 3% in King, 3.7% in Pierce, and 1.8% in Whatcom. White adults came in third with roughly 1.5% and 2.6% eviction rates while Asian adults faced the lowest rate of 0.5% and 1.7%.34
When comparing each of these racial groups to the White eviction rates, Black adults are evicted 5.5 times more than Whites in King County, 6.8 times more in Pierce, and only .9 less in Whatcom (see Table 4.2. Latinx adults are evicted 1.9 times and 1.4 times more than whites in King and Pierce and only 10% more in Whatcom. Asian adults are evicted almost half as much as Whites.
| County | Race & Ethnicity | Adults | County Adult Race Percents | Evicted Adults | Percent of Evicted Adults | Eviction Ratio to white |
|---|---|---|---|---|---|---|
| King | White | 1,152,975 | 66.3% | 15,462 | 1.3 % | — |
| King | Black | 95,992 | 5.5% | 9,156 | 9.5 % | 7.1 |
| King | Latinx | 132,460 | 7.6% | 4,831 | 3.6 % | 2.7 |
| King | Asian | 285,020 | 16.4% | 3,172 | 1.1 % | 0.8 |
| King | Other | 73,291 | 4.2% | 940 | 1.3 % | 1 |
| Pierce | White | 491,509 | 74% | 11,845 | 2.4 % | — |
| Pierce | Black | 43,756 | 6.6% | 7,277 | 16.6 % | 6.9 |
| Pierce | Latinx | 53,993 | 8.1% | 2,524 | 4.7 % | 1.9 |
| Pierce | Asian | 42,436 | 6.4% | 1,029 | 2.4 % | 1 |
| Pierce | Other | 32,668 | 4.9% | 916 | 2.8 % | 1.2 |
| Snohomish | White | 470,466 | 76.4% | 10,508 | 2.2 % | — |
| Snohomish | Black | 16,073 | 2.6% | 2,028 | 12.6 % | 5.6 |
| Snohomish | Latinx | 46,530 | 7.6% | 2,314 | 5 % | 2.2 |
| Snohomish | Asian | 60,801 | 9.9% | 853 | 1.4 % | 0.6 |
| Snohomish | Other | 22,304 | 3.6% | 463 | 2.1 % | 0.9 |
| Whatcom | White | 146,497 | 82.6% | 2,024 | 1.4 % | — |
| Whatcom | Black | 1,534 | 0.9% | 119 | 7.8 % | 5.6 |
| Whatcom | Latinx | 12,380 | 7% | 274 | 2.2 % | 1.6 |
| Whatcom | Asian | 7,567 | 4.3% | 54 | 0.7 % | 0.5 |
| Whatcom | Other | 9,475 | 5.3% | 89 | 0.9 % | 0.7 |
Urban Institute 2018: DC’s Eviction Filings Are Down. Are High Rents to Blame?↩
Crane, Maureen, and Anthony M. Warnes. “Evictions and prolonged homelessness.” Housing studies 15, no. 5 (2000): 757-773.↩
Desmond, Matthew. “Eviction and the reproduction of urban poverty.” American Journal of Sociology 118, no. 1 (2012): 88-133.↩
Curtis, Marah A., Hope Corman, Kelly Noonan, and Nancy E. Reichman. “Life shocks and homelessness.” Demography 50, no. 6 (2013): 2227-2253.↩
We estimate the sex of the evicted, based on the names on the eviction summons. Note that summons may not include all persons living in the premises, but most likely contain the names of those who have signed the rental agreement and any other adult in the household.↩
We estimate race of the evicted based on the name and census tract. While our methodology gives good overall estimates, the results may be biased toward the racial majority in the corresponding tracts. However, we have compared these rates to actual demographic intake rates by the Housing Justice Project and they fall within a couple percentage points to their actual intake counts.↩
One drawback from using race estimations and census data is the lack of detail within ethnic groups and, therefore, potential under-evaluation of disparities in evictions. For example, the overall Asian eviction rate is the lowest of all groups, however, there may be some groups within this ethnic category that have a high rate of evictions over another. One possible solution for future work is to disaggregate Asian backgrounds by using their first name, which can be more closely identified with a particular region of Asia and potentially more precise estimation.↩